Send us your samples, and we can measure them live in an online demonstration
Contact us to arrange an online demonstration
"*" indicates required fields
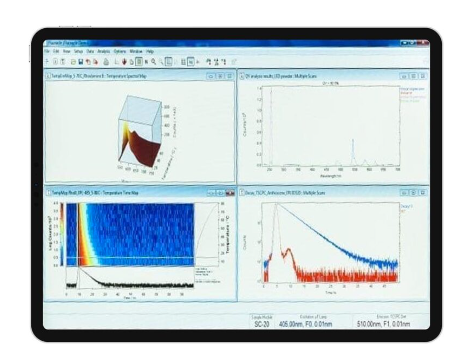
Fluoracle controls all FLS1000, FS5, and Mini-tau series of steady state and time-resolved spectrometers with a straightforward design concept: to enable all modern photoluminescence (PL) spectroscopy applications whilst providing a user-friendly interface with ‘ready to publish’ outputs.
Whether you select a spectral scanning-only version of one of our spectrometer systems, or you go for an advanced version that includes time-correlated single photon counting (TCSPC) lifetime or quantum yield measurements, the software will provide all instrument options automatically, from data acquisition to analysis and presentation. Selection of sources and detection modes is quick and easy: it only takes one second to switch between spectral and time-resolved measurement modes. Fluoracle allows you to monitor the live signal ahead of measurement, so selecting and optimising parameters is quick and straightforward.
Fluorescence Lifetime Imaging Microscopy (FLIM) acquisition and analysis are included in Fluoracle with a MicroPL upgrade.
Fluoracle offers the FAST add-on for the advanced analysis of fluorescence and phosphorescence decay kinetics.
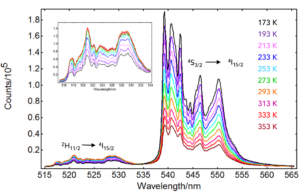
Temperature-dependent PL emission spectra from NaY0.77Yb0.20Er0.03F4. Fluoracle controls the temperature stage so that maps are automatically acquired.
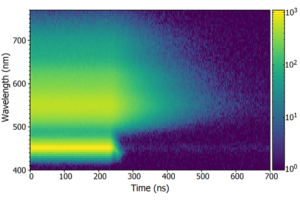
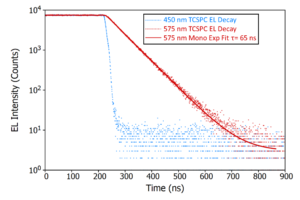
Time-resolved electroluminescence decay of a white light InGaN LED acquired with TCSPC: time-resolved emission spectrum (left) and exponential fit result at 575 nm.
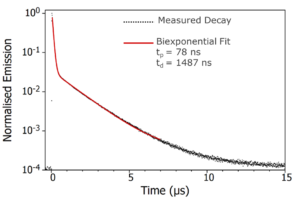
Multichannel scaling (MCS) decay of CzDBA and biexponential fit result. tp = prompt fluorescence lifetime, td = delayed fluorescence lifetime.
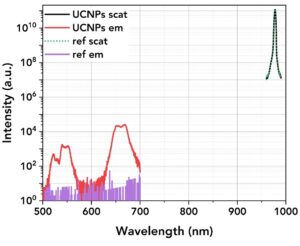
Quantum yield measurement from upconversion nanoparticles (UCNPs). The calculated upconversion quantum yield result is 0.014%.
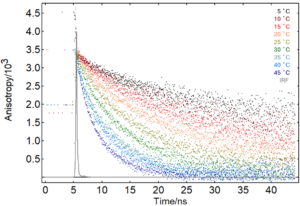
Time-resolved fluorescence anisotropy for a dye in glycerol at different temperatures. Instrument response function plotted in grey.
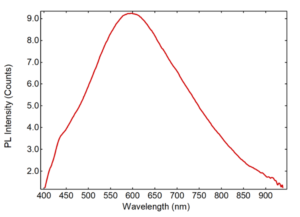
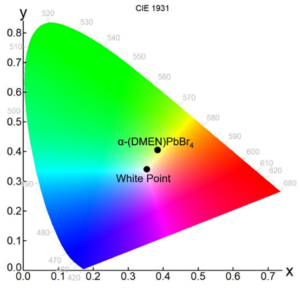
Photoluminescence spectrum and corresponding CIE 1931 chromaticity plot of α-(DMEN)PbBr4 calculated using Fluoracle.
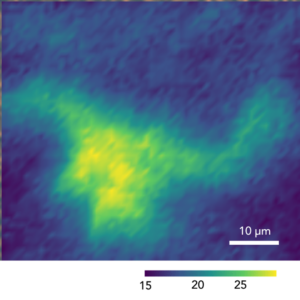
Photoluminescence intensity map of a halide perovskite surface acquired with FluoracleMap software (included with MicroPL accessory).
| Software Functionality for Steady State Spectroscopy | ||
|---|---|---|
| Measurement Modes | Control Features | Data Manipulation and Display |
| Signal rates | Wavelength selection (λEX & λEM) | Arithmetic ( + , - , × , / , append ) |
| Excitation spectra | Grating selection | Scaling / multiplication factor |
| Emission spectra | Spectral bandwidths | Normalise |
| Anisotropy spectra | Integration time per data point (1 ms – 200 s) | Baseline subtraction |
| Kinetic measurements | Sample selection (multi-position sample wells) | Crop range |
| Synchronous spectra | Programmed excitation shutter | Smooth |
| Corrected spectra | Programmed attenuator | 2D, 3D, Contour and text |
| Temperature resolved spectra map | Source and detector selection | Grid ON / OFF |
| Synchronous spectra map | Online spectral data correction | Differentiation / Integration |
| Excitation-emission map | Post acquisition spectral correction | Peak search |
| Sample temperature monitoring | Polariser selection and orientation | Correction |
| Reflection measurements | X-Y Sample stage control | Anisotropy (G factor corrected) |
| Absorption measurements | Sample temperature control | Logarithmic / linear scales |
| Absorptance | Sample selection (multiple cuvette holders) | Comprehensive measurement and file properties for record keeping |
| Reflectance | Temperature control of sample holders | Data manipulation and ASCII / CSV output |
| Batch measurements | Detector gating for phosphorescence spectra | Cursor locations |
| Absolute quantum yield measurements | Cryostat control | Join, split and extract frames |
| Multiple sample position and well-plate measurements | Microscope stage control | Spectral correction wizard |
| Service scans | Plate reader control | Absolute quantum yield wizard |
| Titrator control | Chromaticity calculation and display wizard | |
| Software Functionality for Time-Resolved Photoluminescence Measurements | ||
|---|---|---|
| Measurement modes | Control Features | Analysis Features |
| Signal rates | Wavelength selection for excitation and emission monochromators | Full data reconvolution using a non-linear least square fitting routine: |
| Manual lifetime measurement | Sample selection (multi-position sample holders) | Exponential reconvolution or simple tail fit |
| Multiple lifetime measurement | Detector selection (up to 3) | 1-4 independent exponential decay times, fixed or as free fit parameters |
| Instrument Response Measurement | nF920 flashlamp voltage, frequency control and gas pressure monitor | Shift parameters, fixed or as a free fit parameter |
| Time resolved excitation spectra | External Laser Triggering | Background fit, fixed or as a free fit parameter |
| Time resolved emission spectra | Programmable iris attenuator | Chi-squared goodness-of-fit test |
| Fluorescence anisotropy | Multiple sources | Weighted residuals, Durbin-Watson parameter |
| Temperature controlled lifetime measurements | Polariser selection and orientation | Autocorrelation function |
| Sample temperature monitoring | Cryostat control | Anisotropy calculation |
| Multiple sample position and well-plate measurements | Measurement to peak counts or preset time | Time resolved spectra |
| Forward or Reverse mode | ||
| CFD settings on START and STOP: threshold, zero crossing and divider | ||
| Channel Selection: 512 - 8192 channels (TCSPC) and 500 - 8000 channels (MCS) | ||
| Time Range Selection: 2.5 ns - 50 µs (TCSPC) and 5 ms - 1000 s (MCS) | ||