This application note investigates the application of FTIR spectroscopy for studying the oxidation of ethylene glycol (EG) in a fuel cell. EG is a promising fuel source for fuel cells due to its high energy capacity and boiling point. However, understanding the reaction mechanisms behind EG oxidation is crucial for optimising fuel cell performance.
Traditional electrochemical measurements used to analyse EG-based fuel cells lack information about reaction intermediates. Here, we demonstrate FTIR spectroscopy coupled with electrochemical measurements, providing a powerful method for real-time characterisation of the reaction pathway.
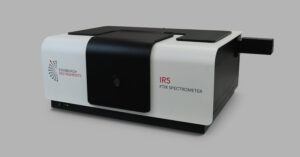
The study uses an Edinburgh Instruments IR5 FTIR spectrometer equipped with an MCT-A detector for enhanced sensitivity, crucial for tracking reaction intermediates. The experimental setup also included an electrochemical workstation with a three-electrode system.
FTIR analysis successfully identified products formed during EG oxidation at the anode of the fuel cell. The observed spectral bands were assigned to specific molecular vibrations, providing valuable insights into the reaction kinetics.
This study highlights the potential of combining FTIR spectroscopy with electrochemical measurements for investigating reaction mechanisms in fuel cells. This approach can contribute significantly to the development of more efficient fuel cell technologies.
Fuel cells that rely on alternative fuel sources to hydrocarbons are promising clean and sustainable energy technologies. In particular, ethylene glycol (EG) has received considerable interest as an alternative fuel choice for a range of mobile, stationary and portable cells. The use of EG boasts promising energy capacities, high boiling points, and remarkable efficacy in electric power conversion.
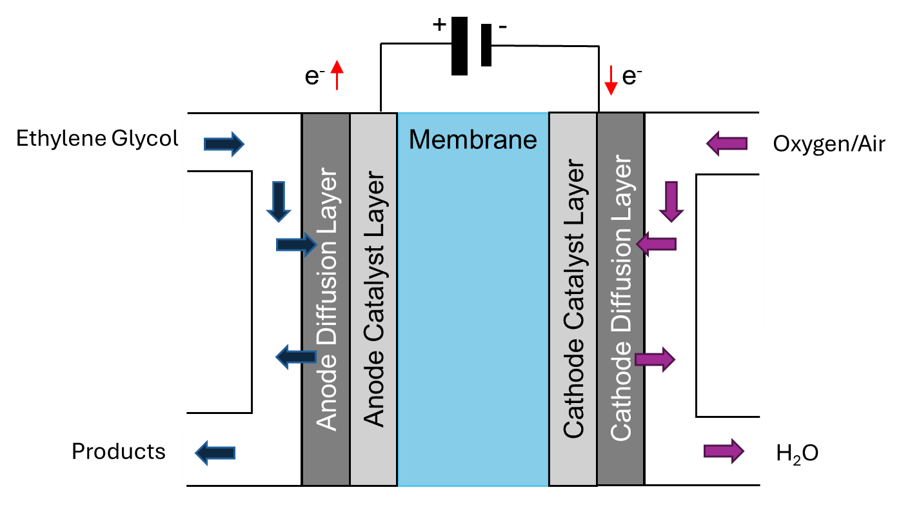
Figure 1. Ethylene glycol fuel cell schematic.
EG-based fuel cells are commonly analysed in situ using electrochemical measurements, but such techniques are limited by the lack of information acquired about reaction intermediates and by extension the reaction pathways. The inclusion of FTIR spectroscopy with electrochemical measurements allows for a simple, yet powerful method of providing real-time molecular characterisation of fuel cells. FTIR spectroscopy allows for a quantitative means of assessing the kinetics of specific molecular transformations, aiding simultaneously acquired electrochemical data.
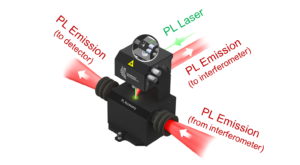
Here, an Edinburgh Instruments IR5 FTIR Spectrometer coupled with an EC-ATR connected to an electrochemical workstation is used to characterise EG oxidation electrochemical reaction in situ.
The oxidation of EG in a 1M KOH solution was analysed using an IR5, equipped with a standard DLaTGS detector for general measurements. However, in-situ electrochemical reactions require higher sensitivity; thus, the second detector port was fitted with an MCT-A detector, offering enhanced sensitivity and faster response times crucial for tracking reaction intermediates. For the electrochemical reaction, the IR5 was coupled to an electrochemical workstation including three electrodes: nickel-plated carbon as the working electrode; Ag/AgCl as the reference electrode and Pt wire as the counter electrode.
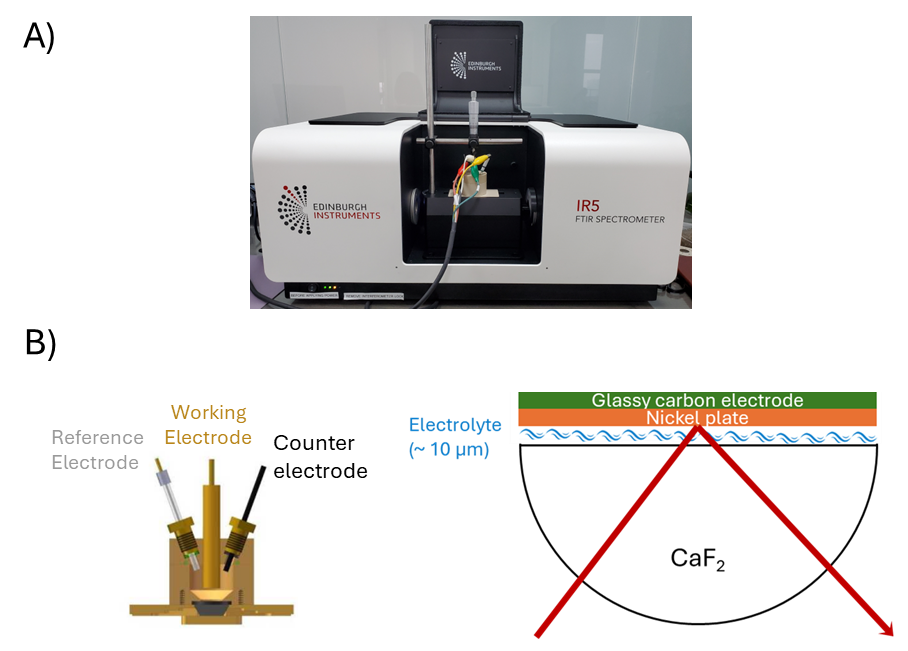
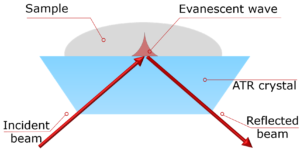
Figure 2. A) Experimental setup using an Edinburgh Instruments FTIR IR5 coupled with B) an EC-ATR. Ag/AgCl reference electrode (RE), nickel-plated carbon working electrode (WE) and Pt wire counter electrode (CE).
In an EG-based fuel cell, oxidation takes place at the anode. The possible reaction pathways are shown in Figure 3.
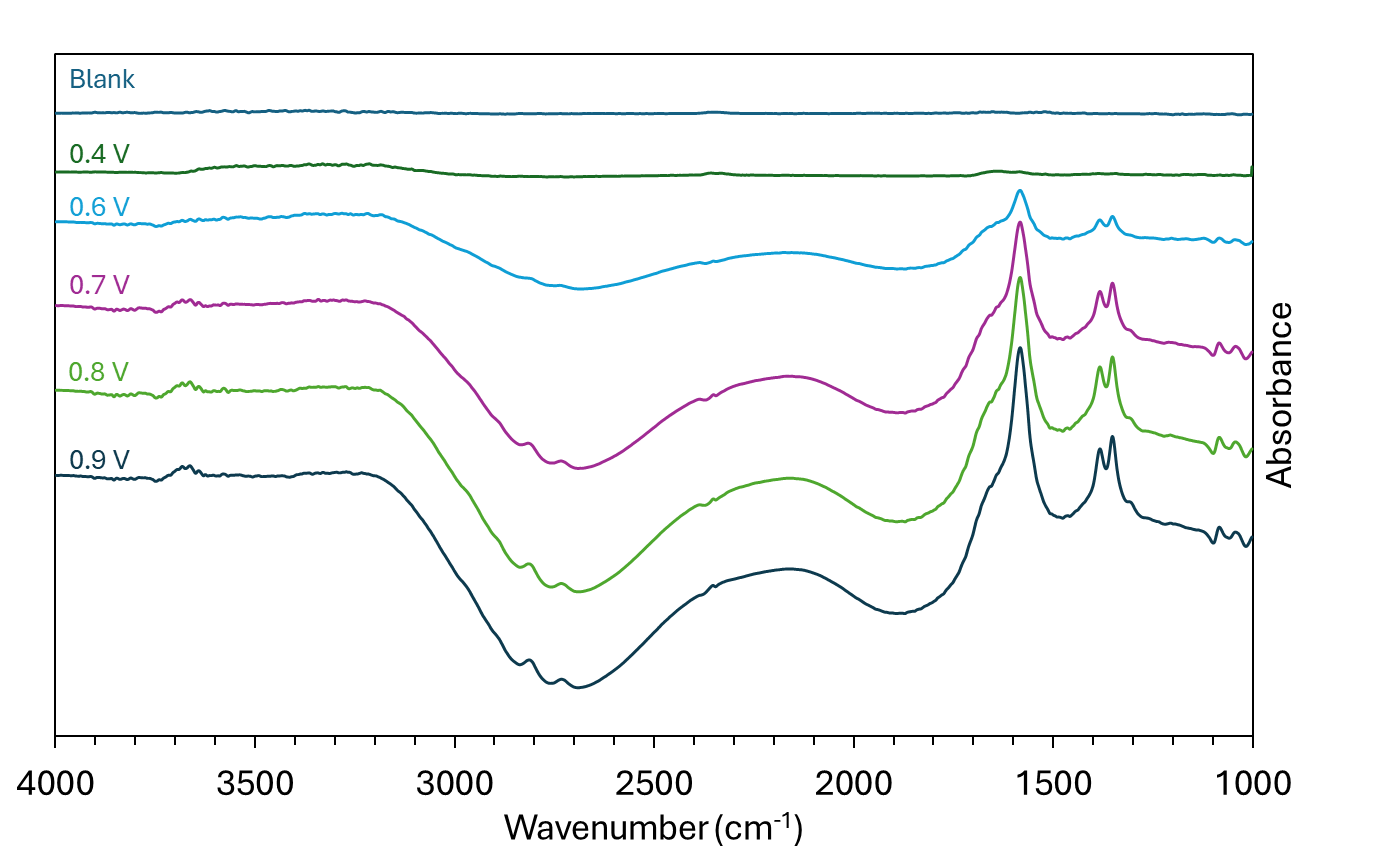
Figure 3. Ethylene glycol reaction pathway oxidation pathway.
Table 1. Frequencies (cm-1) of major infrared bands for various candidate species formed in electrooxidations from ethylene glycol.
| Molecule | Asymmetic (COO–) (cm-1) | Symmetric (COO–) (cm-1) | Other bands (cm-1) |
|---|---|---|---|
| Carbonate | 1390 – 1410 | ||
| Formate | 1581 | 1350, 1381 | |
| Acetate | 1550 | 1411 | |
| Glyoxal | 1581 | 1076 | |
| Glycolate | 1581 | 1326, 1411 | 1076 |
| Glyoxylate | 1581 | 1365 | 1107 |
| Oxalate | 1596 | 1307 |
The reaction intermediates and products generated at the anode under operation can be detected using FTIR spectroscopy. In the electrochemical cell, the voltage was iteratively increased, and the composition of the EG/KOH solution analysed. FTIR spectra acquired at each voltage are shown in Figure 4. A blank was recorded with no voltage, and subsequent samples with increased voltage were divided by this measurement to show the reaction products generated. Vibrational modes were more apparent on FTIR spectra after applying a voltage range from 0.4 – 0.9 V. Bands appear in the regions of 1000-1100 cm-1 from C-O stretching, 1390-1410 cm-1 from carbonate (CO32-), 1583 cm-1 for the carboxylate (COO–) stretch and 3400 – 3700 cm-1 from O-H stretch.
Figure 4. FTIR spectra of ethylene glycol in 1 M KOH at varying voltages.
EG oxidation was successfully monitored using an IR5 configured with a highly sensitive MCT detector and electrochemistry setup. The use of FTIR characterisation coupled with electrochemical setups has great potential to provide invaluable information on intermediate products and kinetics of specific molecular transformations particularly useful in fuel cell development.
(1) Chang, S. C.; Ho, Y.; Weaver, M. J. Applications of Real-Time FTIR Spectroscopy to the Elucidation of Complex Electroorganic Pathways: Electrooxidation of Ethylene Glycol on Gold, Platinum, and Nickel in Alkaline Solution. J. Am. Chem. Soc. 1991, 113 (25), 9506–9513. https://doi.org/10.1021/ja00025a014.