Welcome to Edinburgh Instruments’ blog celebrating our work in Raman, Photoluminescence, and Fluorescence Lifetime Imaging. Every month, we aim to highlight our pick for Map of the Month to show how our Raman and fluorescence spectrometers can be used to reveal all the hidden secrets in your samples.
In Raman microscopy, it is often desirable to collect information from a sample at either high or low temperatures. Studies of this kind are invaluable to study phase transitions, chemical reactions, heterogeneous catalysis mechanisms, the properties of a sample under real-world conditions, and build calibration models for non-invasively determining the temperature of a sample. Using Raman scattering to determine the temperature of a sample is called Raman thermometry.
This video shows how we set up temperature measurements on Edinburgh Instruments Raman Microscopes. In short, we can place the sample in a temperature-controlled chamber, such as a Linkam THMS600 Heating and Cooling Stage, which has a range between -195 to 600 degrees Celsius. When coupled to the RM5, Raman and photoluminescence spectra can be acquired from samples at both low and high temperatures. When the stage is coupled with the RMS1000 Multimodal Confocal Microscope, it is also possible to acquire second harmonic generation spectra and fluorescence lifetime profiles at a controlled temperature.
The temperature of the stage can be controlled using Ramacle software, enabling Raman spectra to be recorded at the temperatures you require for your research. Customised temperature ramps and images at fixed high/low temperatures can also be recorded.
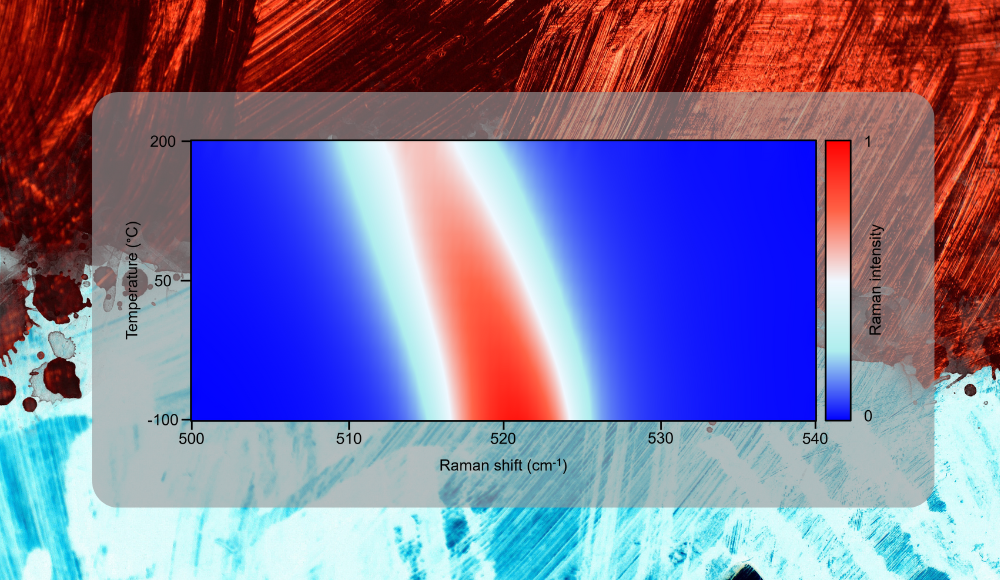
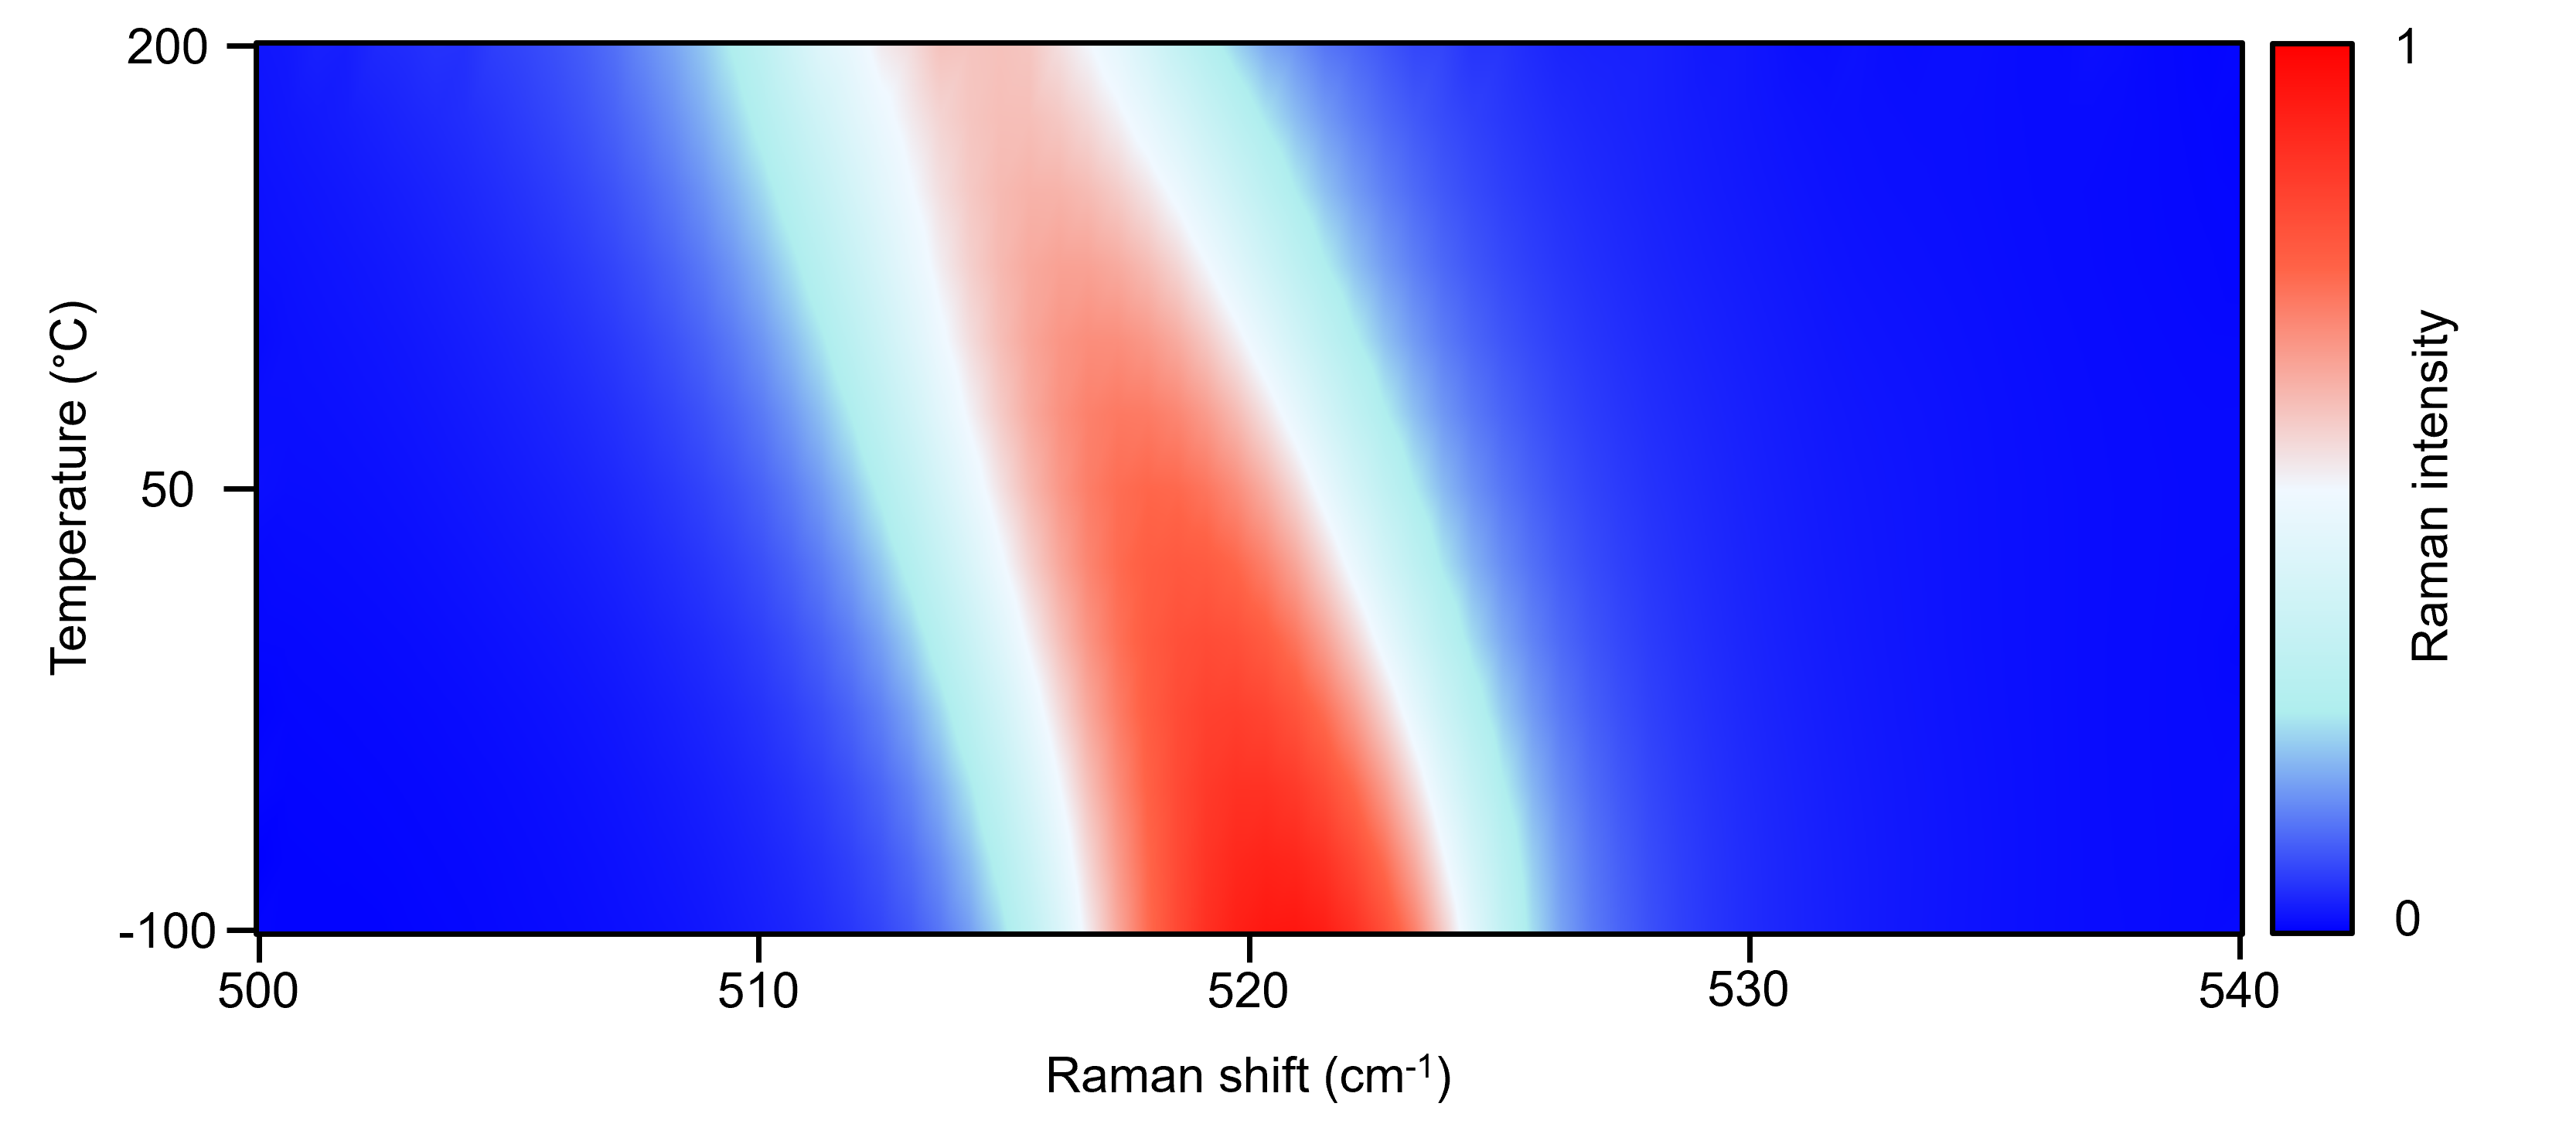
In this Map of the Month, we show a temperature ramp recorded of a Si chip between -100 and 200 degrees Celsius. The image shows a map of the changing Raman signatures with varying temperature. We see that as the temperature is increased, the intensity of the phonon mode at 520 cm-1 decreases, and the Raman peak position changes. The signal decreases in intensity because this is a Stokes Raman measurement, which becomes less intense than Anti-Stokes scattering at high temperatures. The peak position decreases due to bond length and force constant changes. The peak position of this band could feasibly be used as a measure of the temperature of the material.
There are more interesting conclusions that can be taken from this type of dataset, but you will have to stay tuned for our upcoming Application Note to find out more!