Circularly Polarised Luminescence (CPL) spectroscopy can be used to measure samples which preferentially emit circularly polarised light (Figure 1). This technique exploits the differential emission of left- and right-circularly polarised light from chiral structures.1
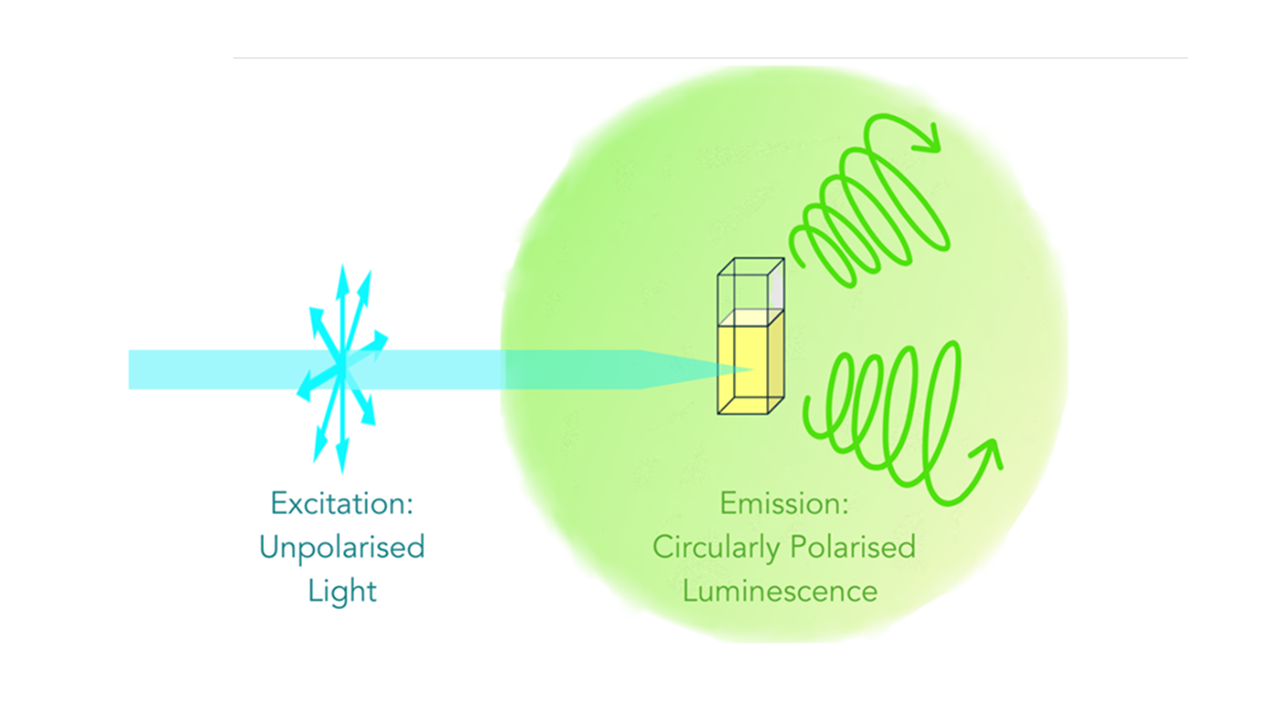
Figure 1. The principles of CPL.
CPL spectroscopy is useful for studying various types of chiral systems, such as organic compounds, inorganic compounds, and biomolecules. By analysing the polarisation state of the emitted luminescence, researchers can gain detailed information about the electronic transitions, molecular symmetry, and stereochemistry of a sample.
In this Technical Note, we describe how CPL spectra can be measured using the Edinburgh Instruments FLS1000 Photoluminescence Spectrometer with CPL Upgrade.
To calculate the degree of circularly polarised luminescence a sample emits, first, the emission circular intensity differential (ECID) is calculated (Equation 1). This measures the difference in intensity between left- and right-circularly polarised emitted light.

IL and IR denote the intensities of left and right circularly polarised components of the emitted radiation, respectively. The circular polarisation of luminescence is also often expressed as a dissymmetry factor (glum) and is calculated using Equation 2.

The glum value varies between +2 (100% left-handed emission) and -2 (100% right-handed emission). An achiral molecule will have a glum value of 0.
The FLS1000 CPL Upgrade consists of a photoelastic modulator (PEM) and photon counting electronics (Figure 2) allowing the CPL (or ECID) spectrum and dissymmetry spectrum to be collected in a single measurement.
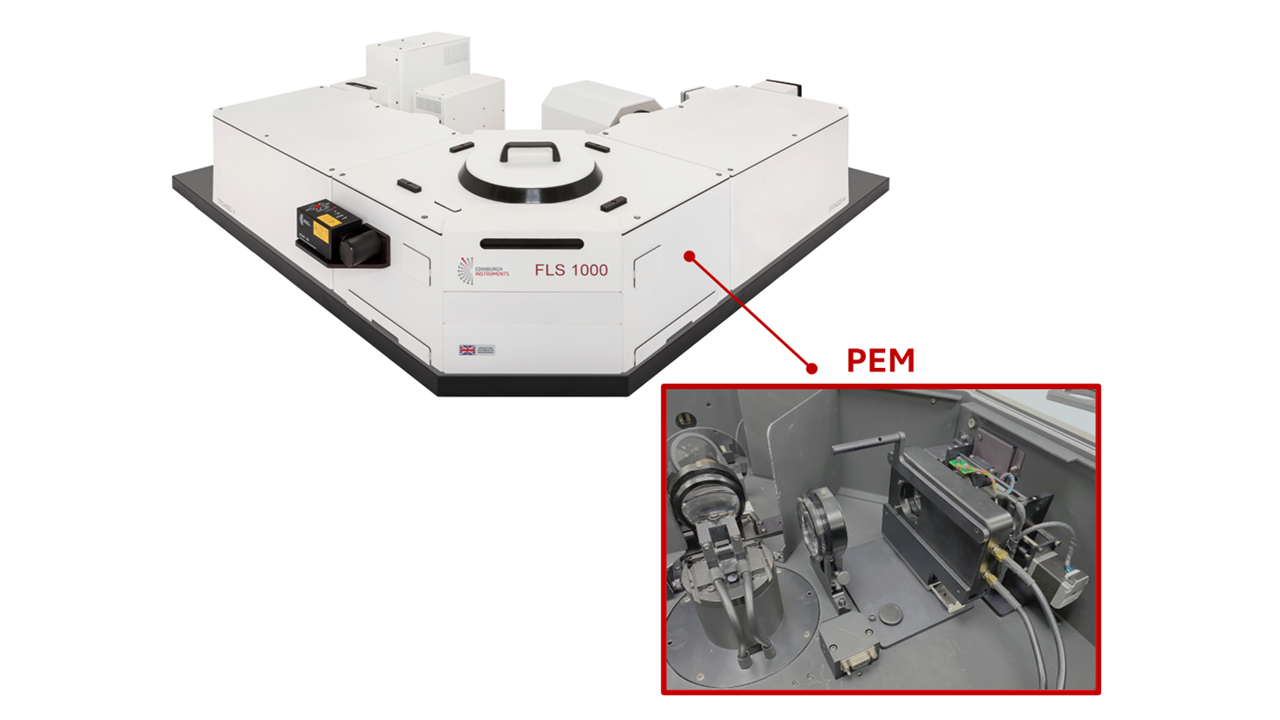
Figure 2. FLS1000 Photoluminescence Spectrometer. The inset photo shows the sample chamber of FLS1000 with the PEM installed.
First, a sample is irradiated with non-polarised light. The sample then emits left- and right-CPL and the emitted light passes through a circular analyser which comprises a PEM and linear linear polariser.
The PEM is positioned in the emission path of the system, followed by a linear polariser orientated at a 45° angle to the PEM axis. The PEM acts as a switchable quarter-wave plate which quickly rotates by 90° between the horizontal and vertical axes. The PEM has a switching frequency of 50 kHz, meaning that in 20 µs, a full voltage sweep is completed. A single voltage sweep is illustrated in Figure 3 and the optical and electrical setup of the system is shown in Figure 4.
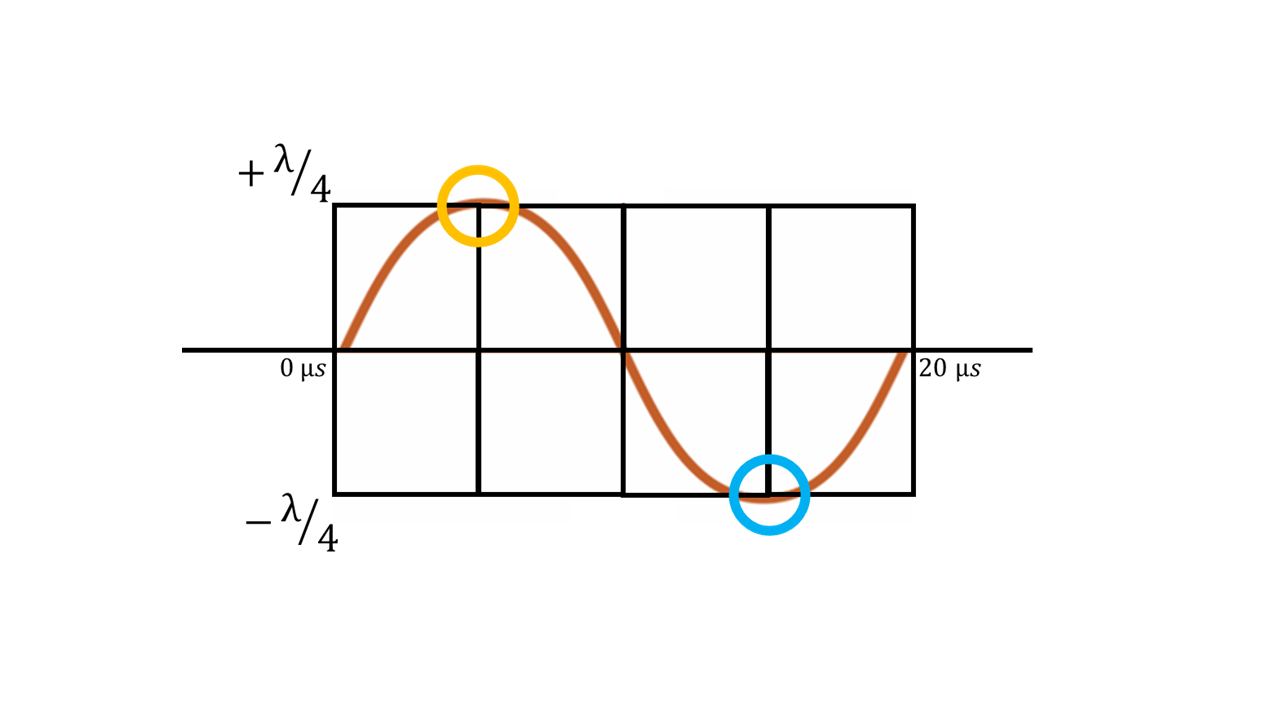
Figure 3. CPL timing schematic to visualise a single voltage sweep with amplitude values corresponding to ±λ/4 (orange curve). The orange circle indicates where the left-handed emission data is acquired and the blue circle where the right-handed emission data is acquired.
As shown in Figure 3, a single voltage sweep can be represented by a sinusoidal curve. When the curve reaches the orange circle, a measurement is taken which is sent to the IL spectrum (Figure 4A). The sweep continues until the blue circle where another measurement is taken and sent to the IR spectrum (Figure 4B). The spectra are built up through several sweeps per point before the results are displayed.
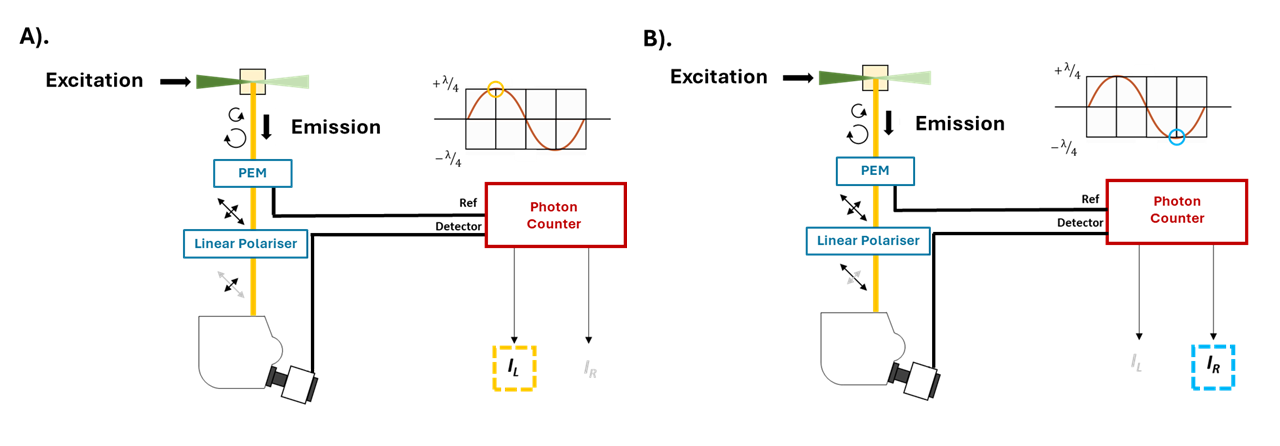
Figure 4. Optical and electrical setup for CPL measurements using an FLS1000 PL spectrometer During a full voltage sweep of the system isolates A). left-handed polarisation and B). right-handed polarisation to build the spectra.
The widely reported chiral complex, Europium tris[3-(trifluoromethylhydroxy-methylene) -(+)-camphorate], or Eu(facam)3, was analysed to demonstrate CPL measurements. This complex has a strong dissymmetry factor of -0.7 to -0.8, and the structure is shown in Figure 5.2,3

Figure 5. Molecular structure of the reference sample for CPL measurements, Eu(facam)3.
The sample solution was prepared in DMSO, and measurements were performed using a quartz cuvette. The measurement parameters are shown in Table 1.
Table 1. Experimental parameters for CPL measurements of Eu(facam)3.
| Parameter | Measurement |
| Excitation source | 450 W Xe lamp |
| Excitation wavelength | 373 nm |
| Excitation bandwidth | 5 nm |
| Emission bandwidth | 1 nm |
| Emission step size | 0.5 nm |
| Emission integration time (per point) | 0.2 s |
| Number of scans | 5 |
| Detector | PMT-900 |
The results, comprising the glum spectrum and normalized CPL spectrum, are shown in Figure 6. The results show the magnetic dipole transition band at 595 nm. The additional band at 611 nm is due to the electronic-dipole transition. The strong signal confirms the presence of the chiral facam ligand.
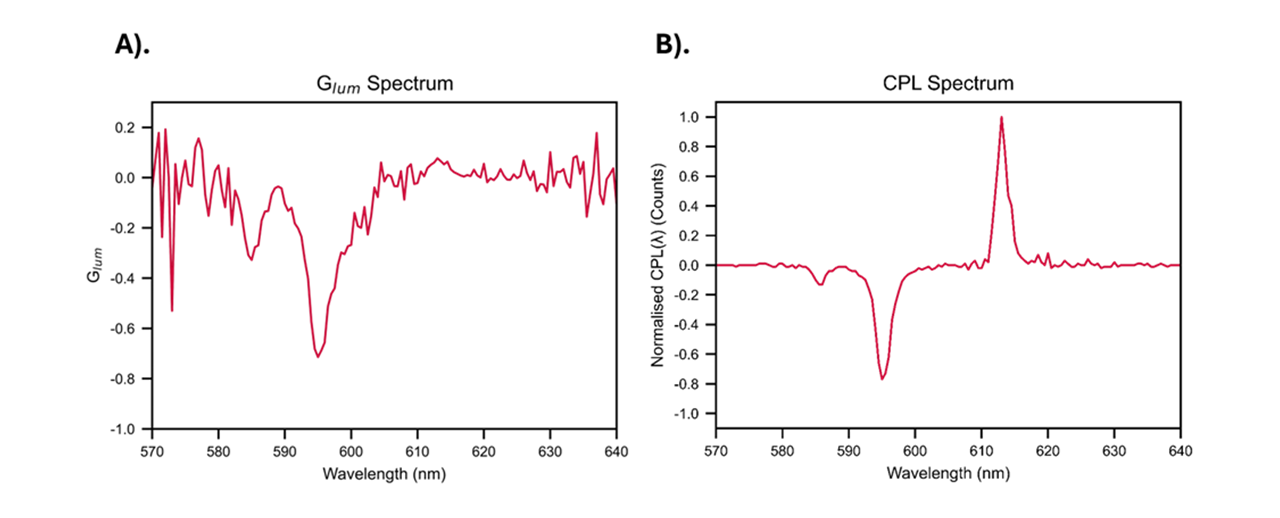
Figure 6. CPL spectroscopy analysis of Eu(facam)3 in DMSO. A). glum spectrum B). Normalised CPL spectrum.
The glum quantifies the asymmetric environment surrounding the complex metal ions. The results showed the sample has a glum value of around -0.8 for the 595 nm transition band which agrees with published literature and confirms a chiral species was present.2, 3
The specifications for the CPL Upgrade for the FLS1000 PL spectrometer are shown in Table 2.
Table 2. CPL Upgrade Specifications.
| CPL Upgrade | Specification |
| Wavelength Range | 200 nm – 900 nm |
| Frequency | 50 kHz |
| glum Lower Limit | 0.005 |
The FLS1000 can perform CPL measurements when coupled with the CPL Upgrade. CPL measurements and calculations are carried out using Fluoracle® software with the custom CPL calculation wizard and CPL Upgrade control functionality.