In our ongoing Year of Graphene series, we’ve showcased why Raman microscopy is ideal for analysing graphene and other 2D materials. But what exactly is a Raman microscope, and what factors should be considered to optimise it for graphene analysis?
Let’s break down the basics of a confocal Raman microscope. The starting point is always the laser (shown in red), the wavelength of which profoundly influences the resulting spectrum, impacting both signal intensity and spectral resolution. This laser light is directed onto the sample via a microscope (green), equipped with an objective lens. The choice of objective lens determines the spatial resolution, with higher magnification allowing finer details to be resolved.
When the laser interacts with the graphene sample, Raman scattering occurs. The objective collects this scattered light, which is then directed to a spectrograph for detection (blue). The spectrograph separates the light into its constituent wavelengths, and it is then detected using a sensitive camera called a charged-coupled device (CCD) to give the Raman spectrum of the graphene.
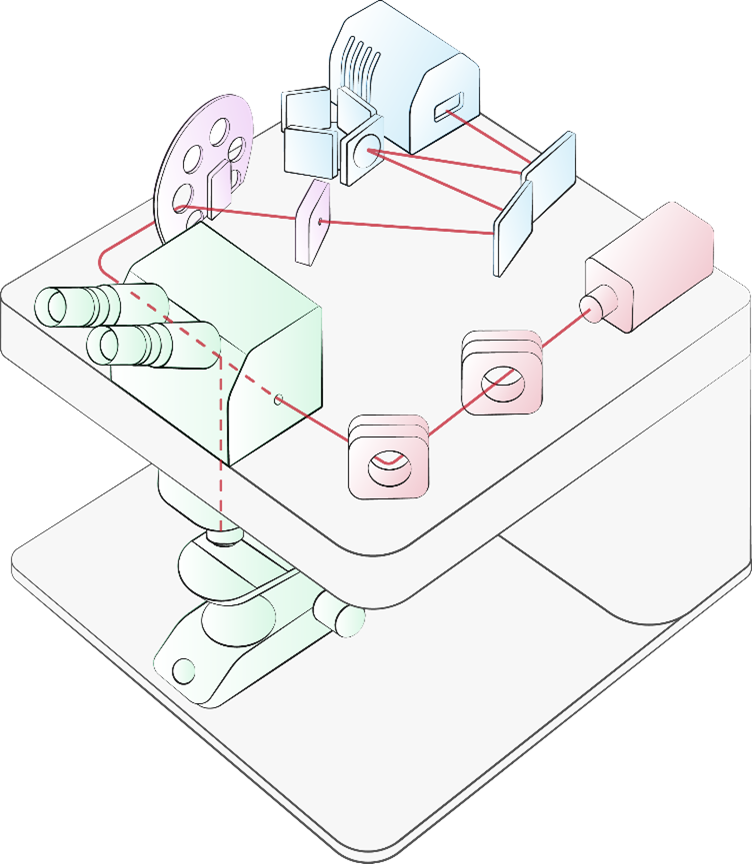
Figure 1: Layout of a Raman Microscope
Raman microscopes are used in every area of science and technology. You’ll find them in biology, chemistry, and physics academic labs; and in industry for both R&D and quality control. To cater to this broad spectrum of applications, the components of a Raman microscope can be tailored to meet specific requirements. Consequently, when analysing graphene (and related materials), what factors should be taken into account?
The primary consideration in analysing graphene is the choice of laser wavelength. There are 3 main bands of interest in the Raman spectra of graphene, the G-band, the D-band, and the 2D-band. 532 nm excitation is commonly used for graphene characterisation due to its strong resonance enhancement of the G-band and 2D-band. These bands are indicative of the number of layers of graphene present and the quality of the sample. Briefly, resonance Raman spectroscopy uses a laser with a wavelength that matches an electronic transition of the molecule, enhancing the Raman scattering signal and providing detailed information about molecular structure and dynamics in a sample.
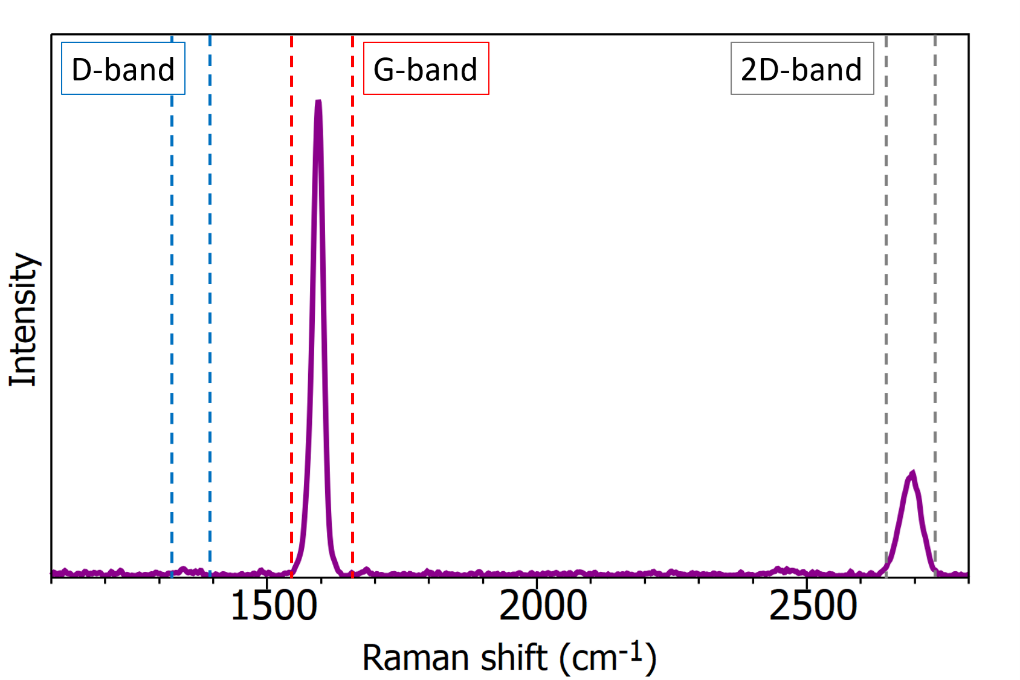
Figure 2: Raman spectrum of graphene
Most Raman microscopes can accommodate more than one laser, and 633 nm is a popular alternative laser wavelength. While 633 nm excitation is less commonly used for graphene analysis compared to 532 nm, it can still provide valuable insights, especially for samples where the 532 nm laser may induce unwanted effects such as photodegradation. Due to the resonance properties of the main bands of graphene, it is important to always use the same laser wavelength when investigating samples to allow for comparisons to be made.
Another method to prevent photodegradation is to control the laser power interacting with the sample. Therefore, Raman microscopes typically feature laser attenuation, which the user can adjust to ensure that the selected laser does not damage the sample.
Achieving high spatial resolution is essential when examining graphene samples, such as flakes. This can be accomplished by using high-magnification objectives. In Raman microscopes, objectives can be easily exchanged, allowing users to capture low-resolution Raman images to identify areas of interest and then switch to higher-resolution objectives to achieve precise spatial resolution.
Graphene peaks are relatively close together in the spectrum, and a high spectral resolution is required for accurate peak fitting and quantitative analysis of properties such as layer thickness and defect density. This is where the spectrograph’s grating comes into play. Configuring the Raman microscope with a high-resolution grating means these peaks can be accurately resolved, and an 1800 gr/mm or 2400 gr/mm grating is recommended.
The final decision is the CCD detector. In Raman microscopy, two types of CCDs are used: front-illuminated and back-illuminated. A back-illuminated CCD is preferred for analysing graphene because it allows more efficient detection of Raman scattered light. In a back-illuminated CCD, the light enters the sensor from the backside, directly reaching the photosensitive silicon layer without obstruction from metal wiring or other layers. This improves signal-to-noise ratio and enhances sensitivity, particularly for thin or transparent samples like graphene.
In this demonstration, our Raman Applications Scientist, Dr Matthew Berry, demonstrates how the different components of the RM5 Raman microscope discussed above influence the measured spectrum. Using the Ramacle® RM5 software he shows how to optimise the microscope parameters to acquire the optimal spectrum of a sample.