In our ongoing “20 Years of Graphene” series, we’ve already showcased Raman microscopy for the analysis of graphene and other 2D materials, but how exactly do you obtain a great Raman spectrum of graphene? This month’s “20 Years of Graphene” instalment tells you exactly how to set up your Raman microscope to take a great Raman spectrum.
Graphene’s unique chemical structure and bonding make it an ideal sample for Raman spectroscopy. Its hexagonal lattice, with each carbon atom bonded to three adjacent atoms and the remaining p electrons forming π bonds, results in highly polarisable and Raman active vibrational modes. This unique property of graphene makes it perfect for study using Raman spectroscopy.
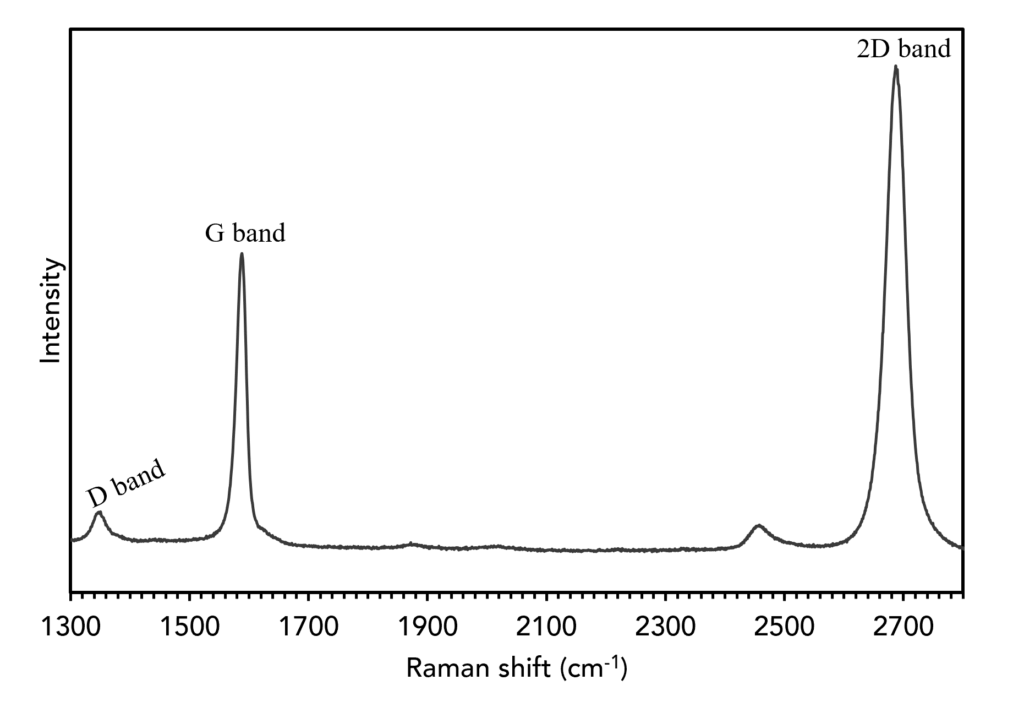
The Raman spectrum of graphene is shown in Figure 1, and the critical vibrational modes are labelled. The G and 2D bands, always present in the Raman spectrum of graphene, can be used to evaluate graphene layer thickness and quality. On the other hand, the D band will only be observed when defects exist in the sample – make it key indicator of graphene quality. The Raman spectrum of graphene can, therefore, provide high levels of information about the material rapidly and with minimal sample preparation.

Figure 1. Raman spectrum of graphene.
A high-quality Raman spectrum of graphene is one with a high signal-to-noise ratio, spectral resolution, and range. It is very important that the settings on your Raman microscope are selected to ensure that you can get the maximum amount of data from your graphene sample. The video below explains exactly how you can obtain high-quality Raman spectra.


