Welcome to Edinburgh Instruments’ blog celebrating our work in Raman, Photoluminescence, and Fluorescence Lifetime Imaging. Every month, we aim to highlight our pick for Map of the Month to show how our Raman and fluorescence spectrometers can be used to reveal all the hidden secrets in your samples.

In the pharmaceutical industry, the synthesis of the correct drug molecule is often not enough to ensure that a product will have the intended effect. Drug compounds can crystallise into different forms, which, if not controlled, can negatively impact the final product’s safety and efficacy. This phenomenon is known as polymorphism, and the control and monitoring of it is of enormous interest to the pharmaceutical industry.
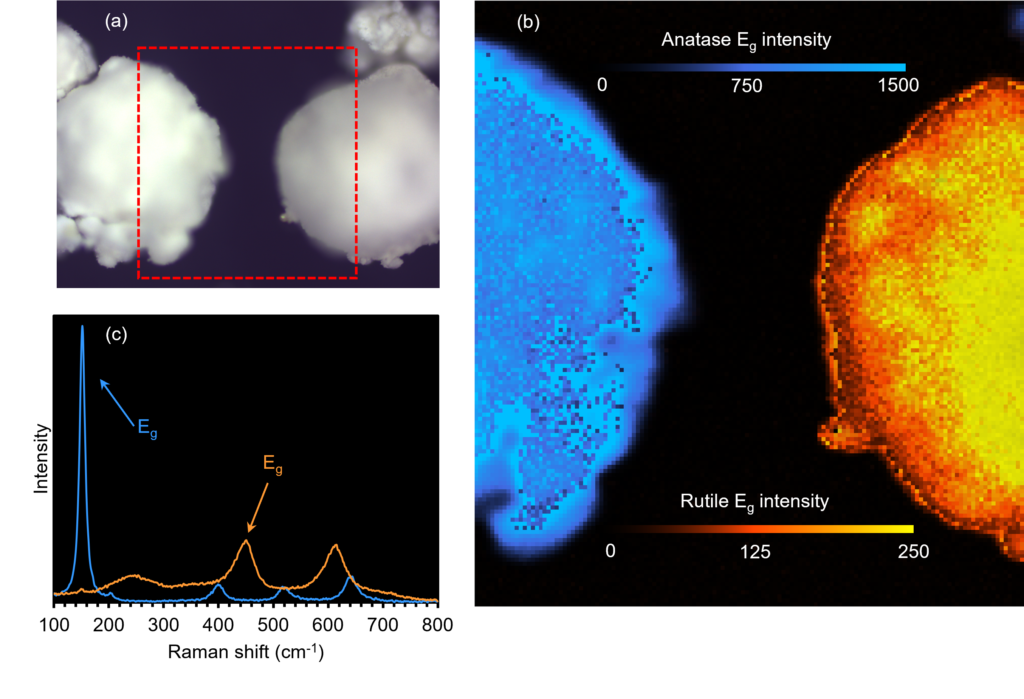
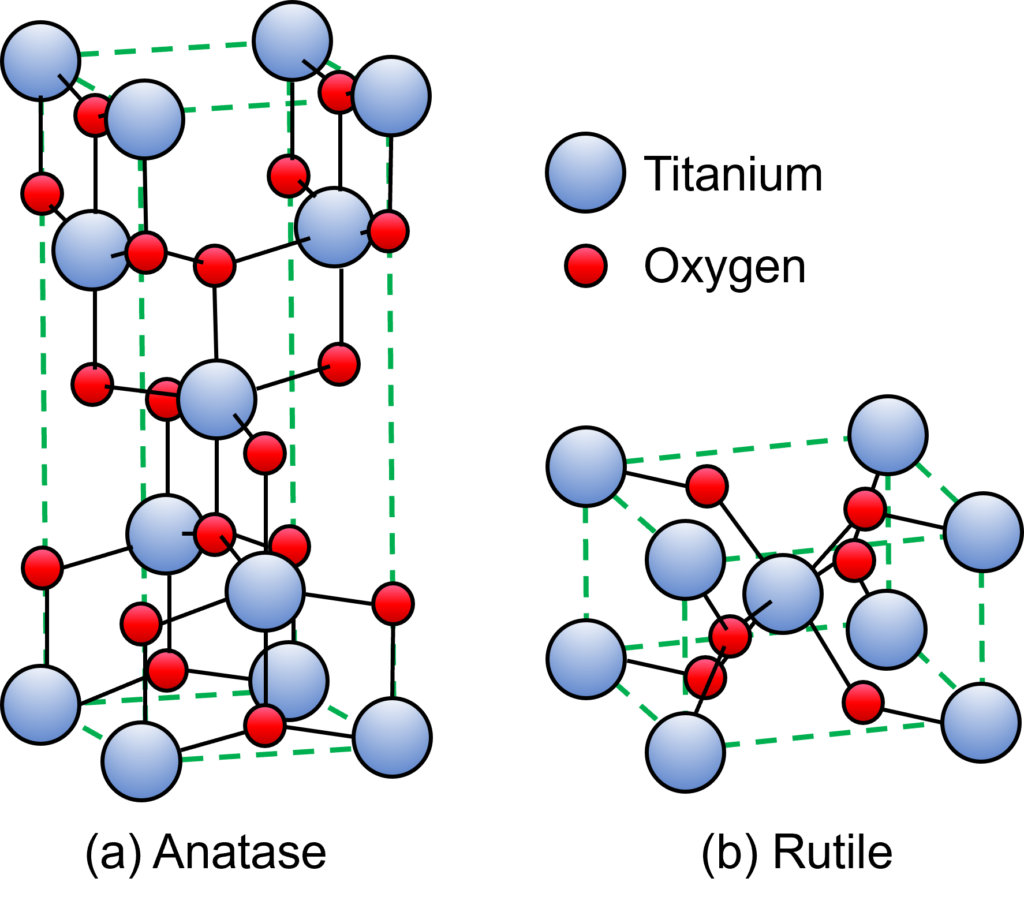
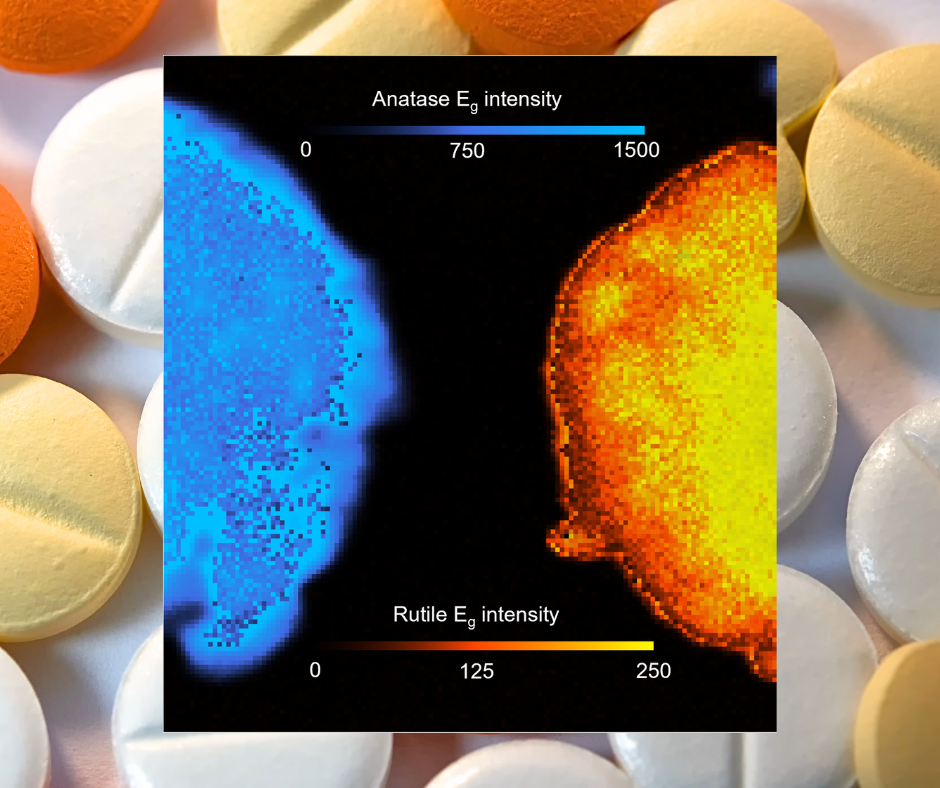
Raman spectroscopy is an excellent technique for identifying polymorphs, and when combined with an optical microscope, different polymorphs in a mixture can quickly be spatially resolved. The example above shows a mixture containing two different polymorphs of the commonly used excipient titanium dioxide, anatase and rutile, which occur when the compound adopts octahedral and tetragonal crystalline structures, respectively. The two large microcrystals look similar when viewed under the microscope using darkfield imaging. However, when the same area is imaged using Raman, it quickly becomes apparent that they are different. The Raman spectral fingerprints indicate that the crystal on the left is anatase, and the crystal on the right is rutile.

If you want to learn more about polymorphism, why not look at our recent Application Note on the topic? In it, we show how Raman can detect extremely subtle spectral differences between polymorphs of a vital drug compound used in the treatment of epilepsy, schizophrenia, and bipolar disorder.

