Welcome to Edinburgh Instruments’ blog celebrating our work in Raman, Photoluminescence, and Fluorescence Lifetime Imaging. Every month, we aim to highlight our pick for Map of the Month to show how our Raman and fluorescence spectrometers can be used to reveal all the hidden secrets in your samples.
Antihistamines are commonly used medications to alleviate allergic symptoms, and their efficacy is directly linked to the presence and purity of the active pharmaceutical ingredient (API). Accurately identifying the API and other essential components, such as bulk excipients and coatings, is critical to ensure the efficacy of antihistamine formulations. Raman microscopy offers detailed chemical information and insights into the spatial distribution and composition of these and many other pharmaceutical products. Raman imaging can, therefore, simultaneously identify and spatially resolve various components.
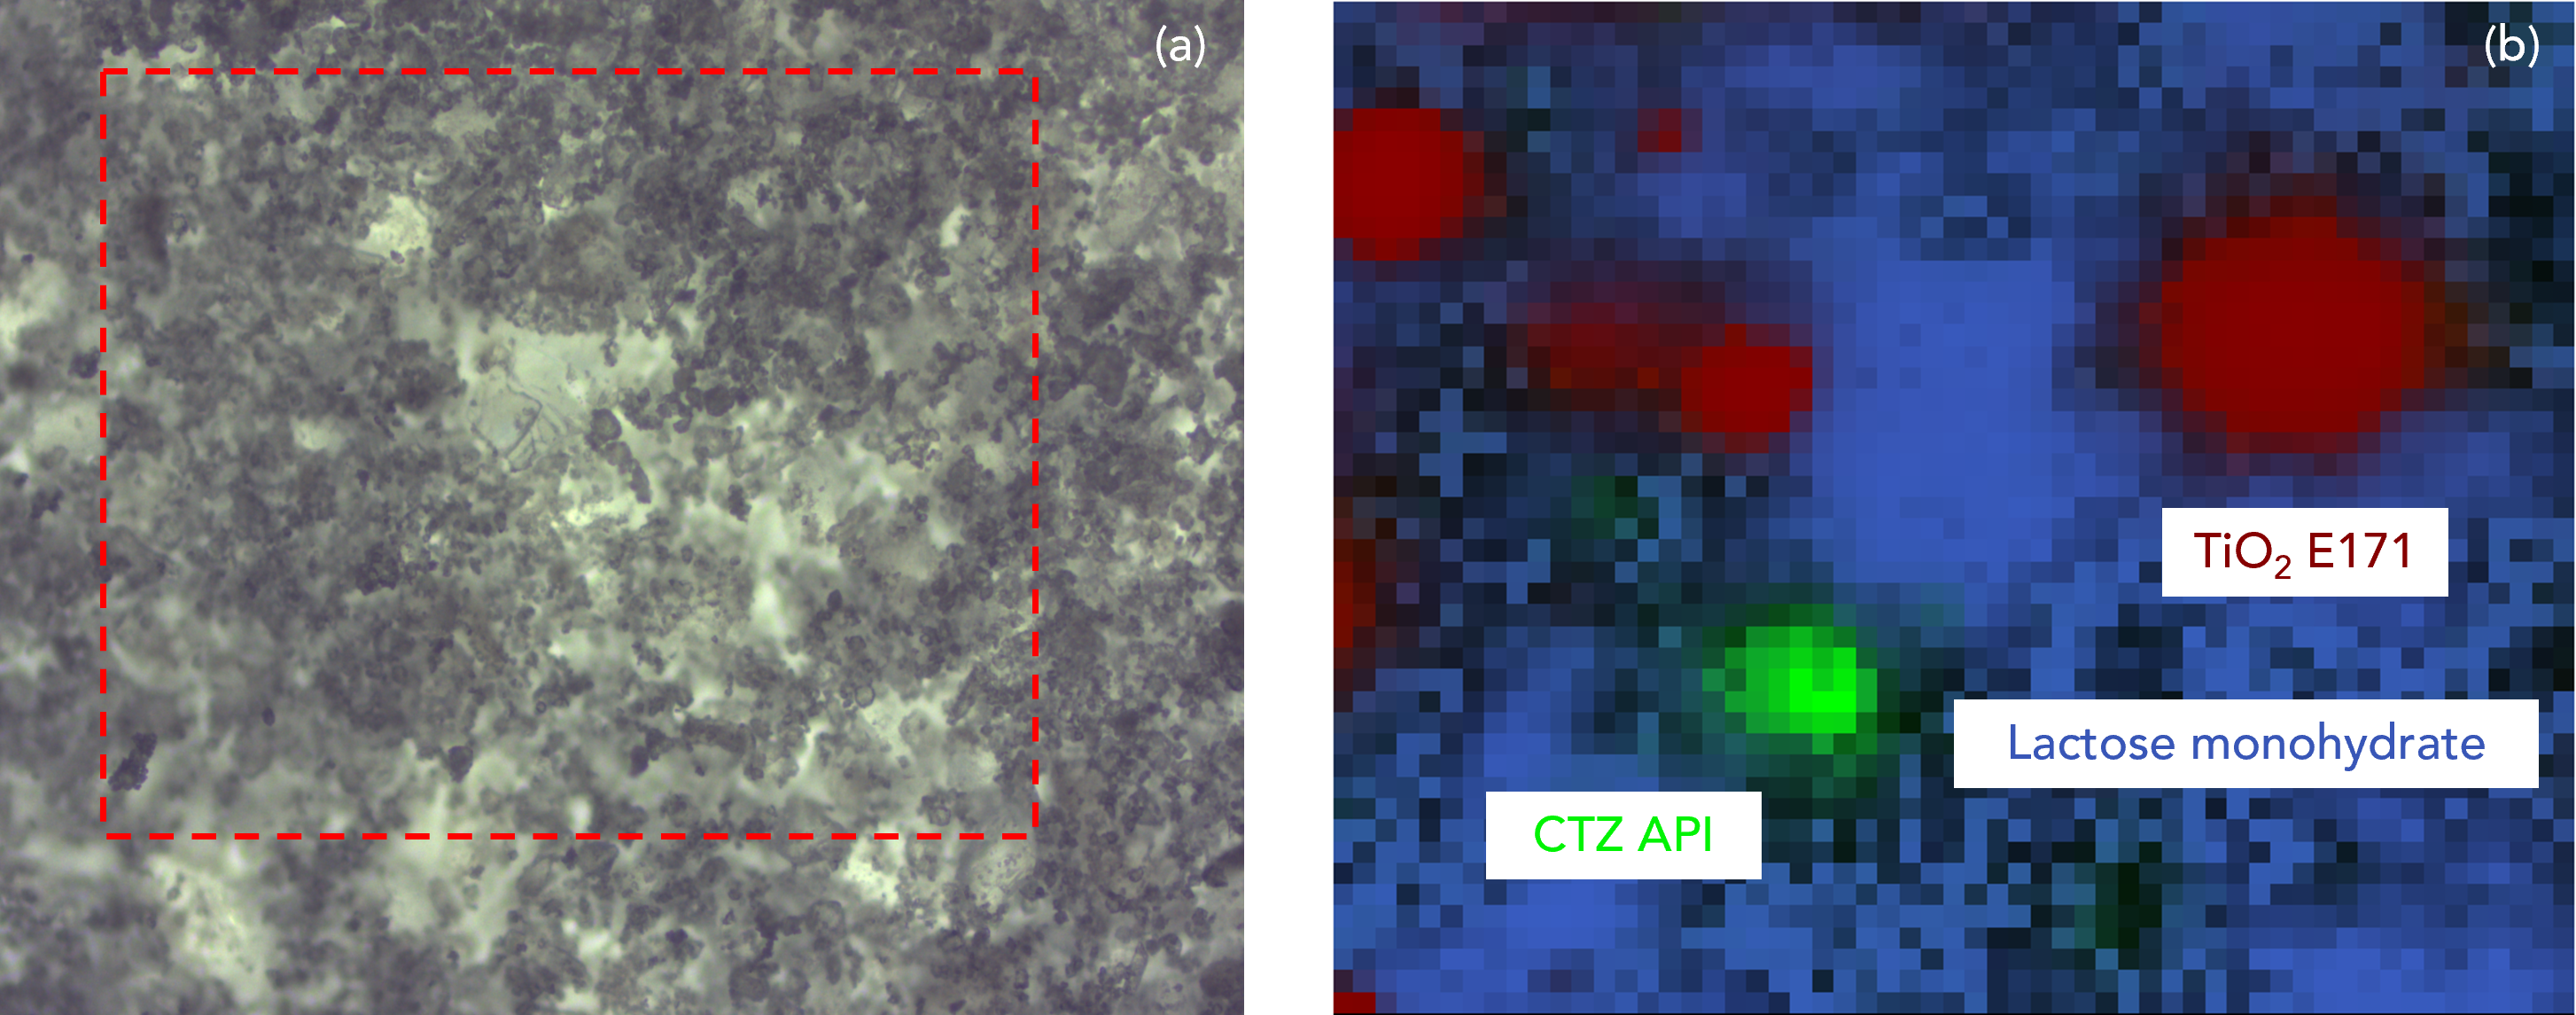
In this Map of the Month, a formulation containing the API cetirizine (CTZ) hydrochloride, a widely used antihistamine, was imaged using the Edinburgh Instruments RM5 Confocal Microscope.
The CTZ is the green cluster in the image. Also detected was the excipient material titanium dioxide E171 (red), which is used in many products as a film coating. It is an inert and scattering material that protects the API in the bulk of the formulation protection against photodegradation. Another excipient material detected was lactose monohydrate (blue), which is widely used as a bulk filler in oral solid dosage formulations because of its inertness, physical stability, wide availability, and low cost.
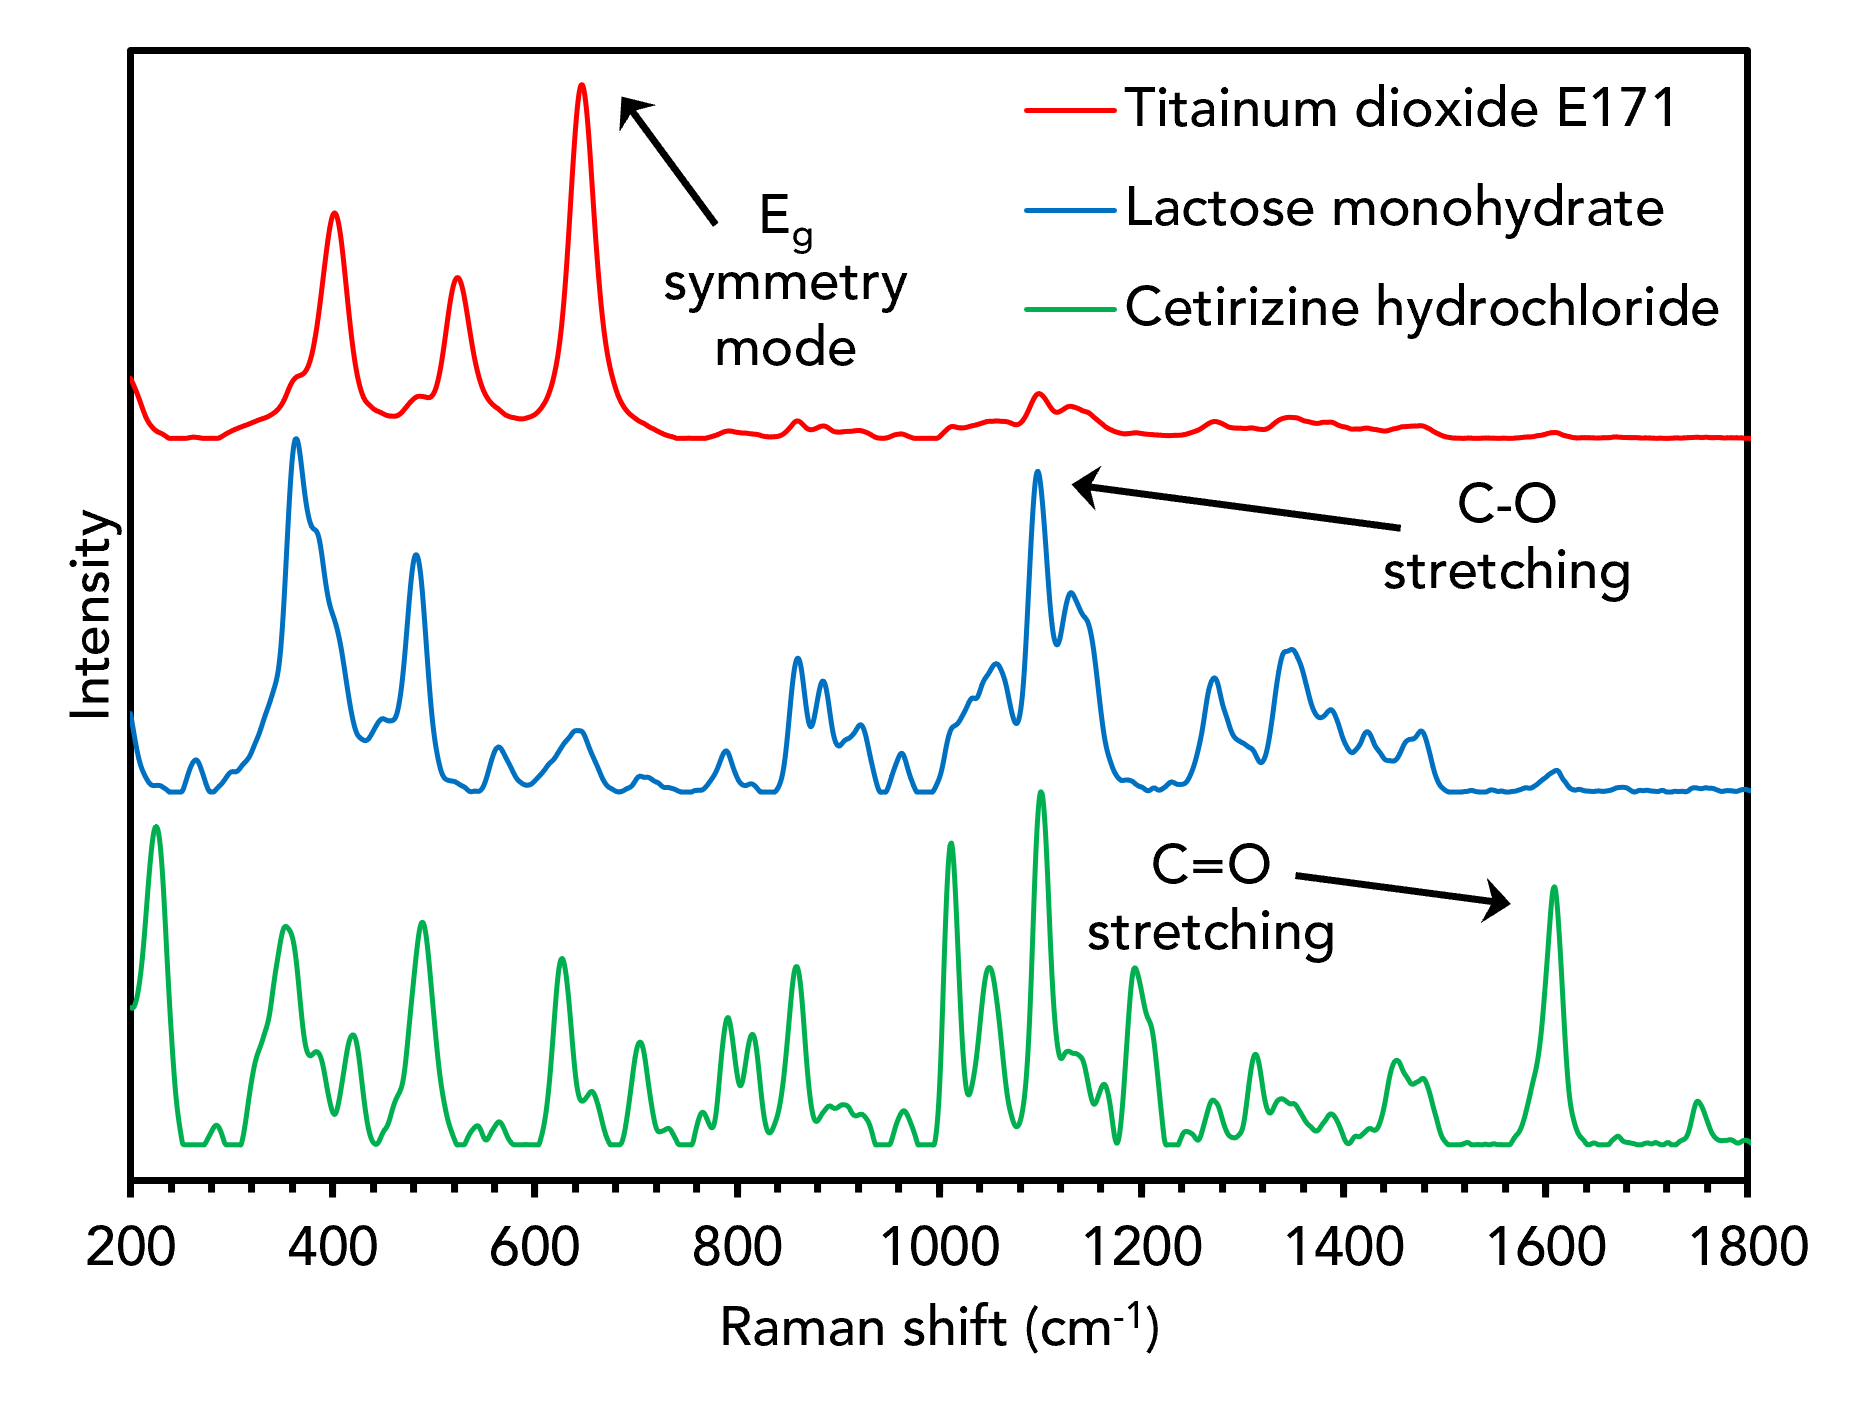
The assignment of each component within the Raman image was determined using their unique vibrational fingerprints, below. The titanium E171 particles were mapped using the intensity of a band at 608 cm-1, which is characteristic of an Eg symmetry mode in the anatase polymorph of the material. The lactose monohydrate filler, which was detected across most of the map, was identified using the intensity of a band at 1100 cm-1. This band occurs at the stretching frequency of C-O functional groups abundant in lactose monohydrate and other saccharides. Finally, the region containing the CTZ API was assigned using the elevated intensity of a band at 1609 cm-1, which is characteristic of C=O stretching.
Are you interested in learning more about how Raman microscopy can be used to characterise pharmaceutical products? Why not check out our eBook, where we show how 2D, 3D, and surface Raman mapping can all be used in pharmaceutical research and quality assurance.

