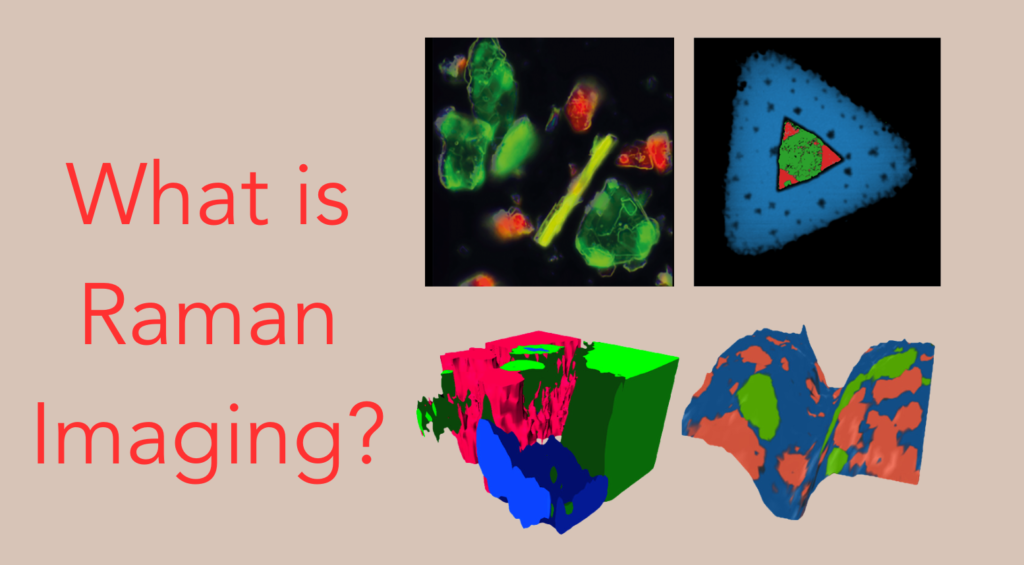
Raman imaging, also called Raman mapping, is a hyperspectral technique where variations in the Raman spectrum across or throughout a sample create a contrast, Figure 1. In a Raman image, each point contains a full Raman spectrum, which is a source of a vast amount of chemical information. False colour images are created from variations in the Raman spectra that allow for spatial information about the chemical composition of the sample to be obtained.
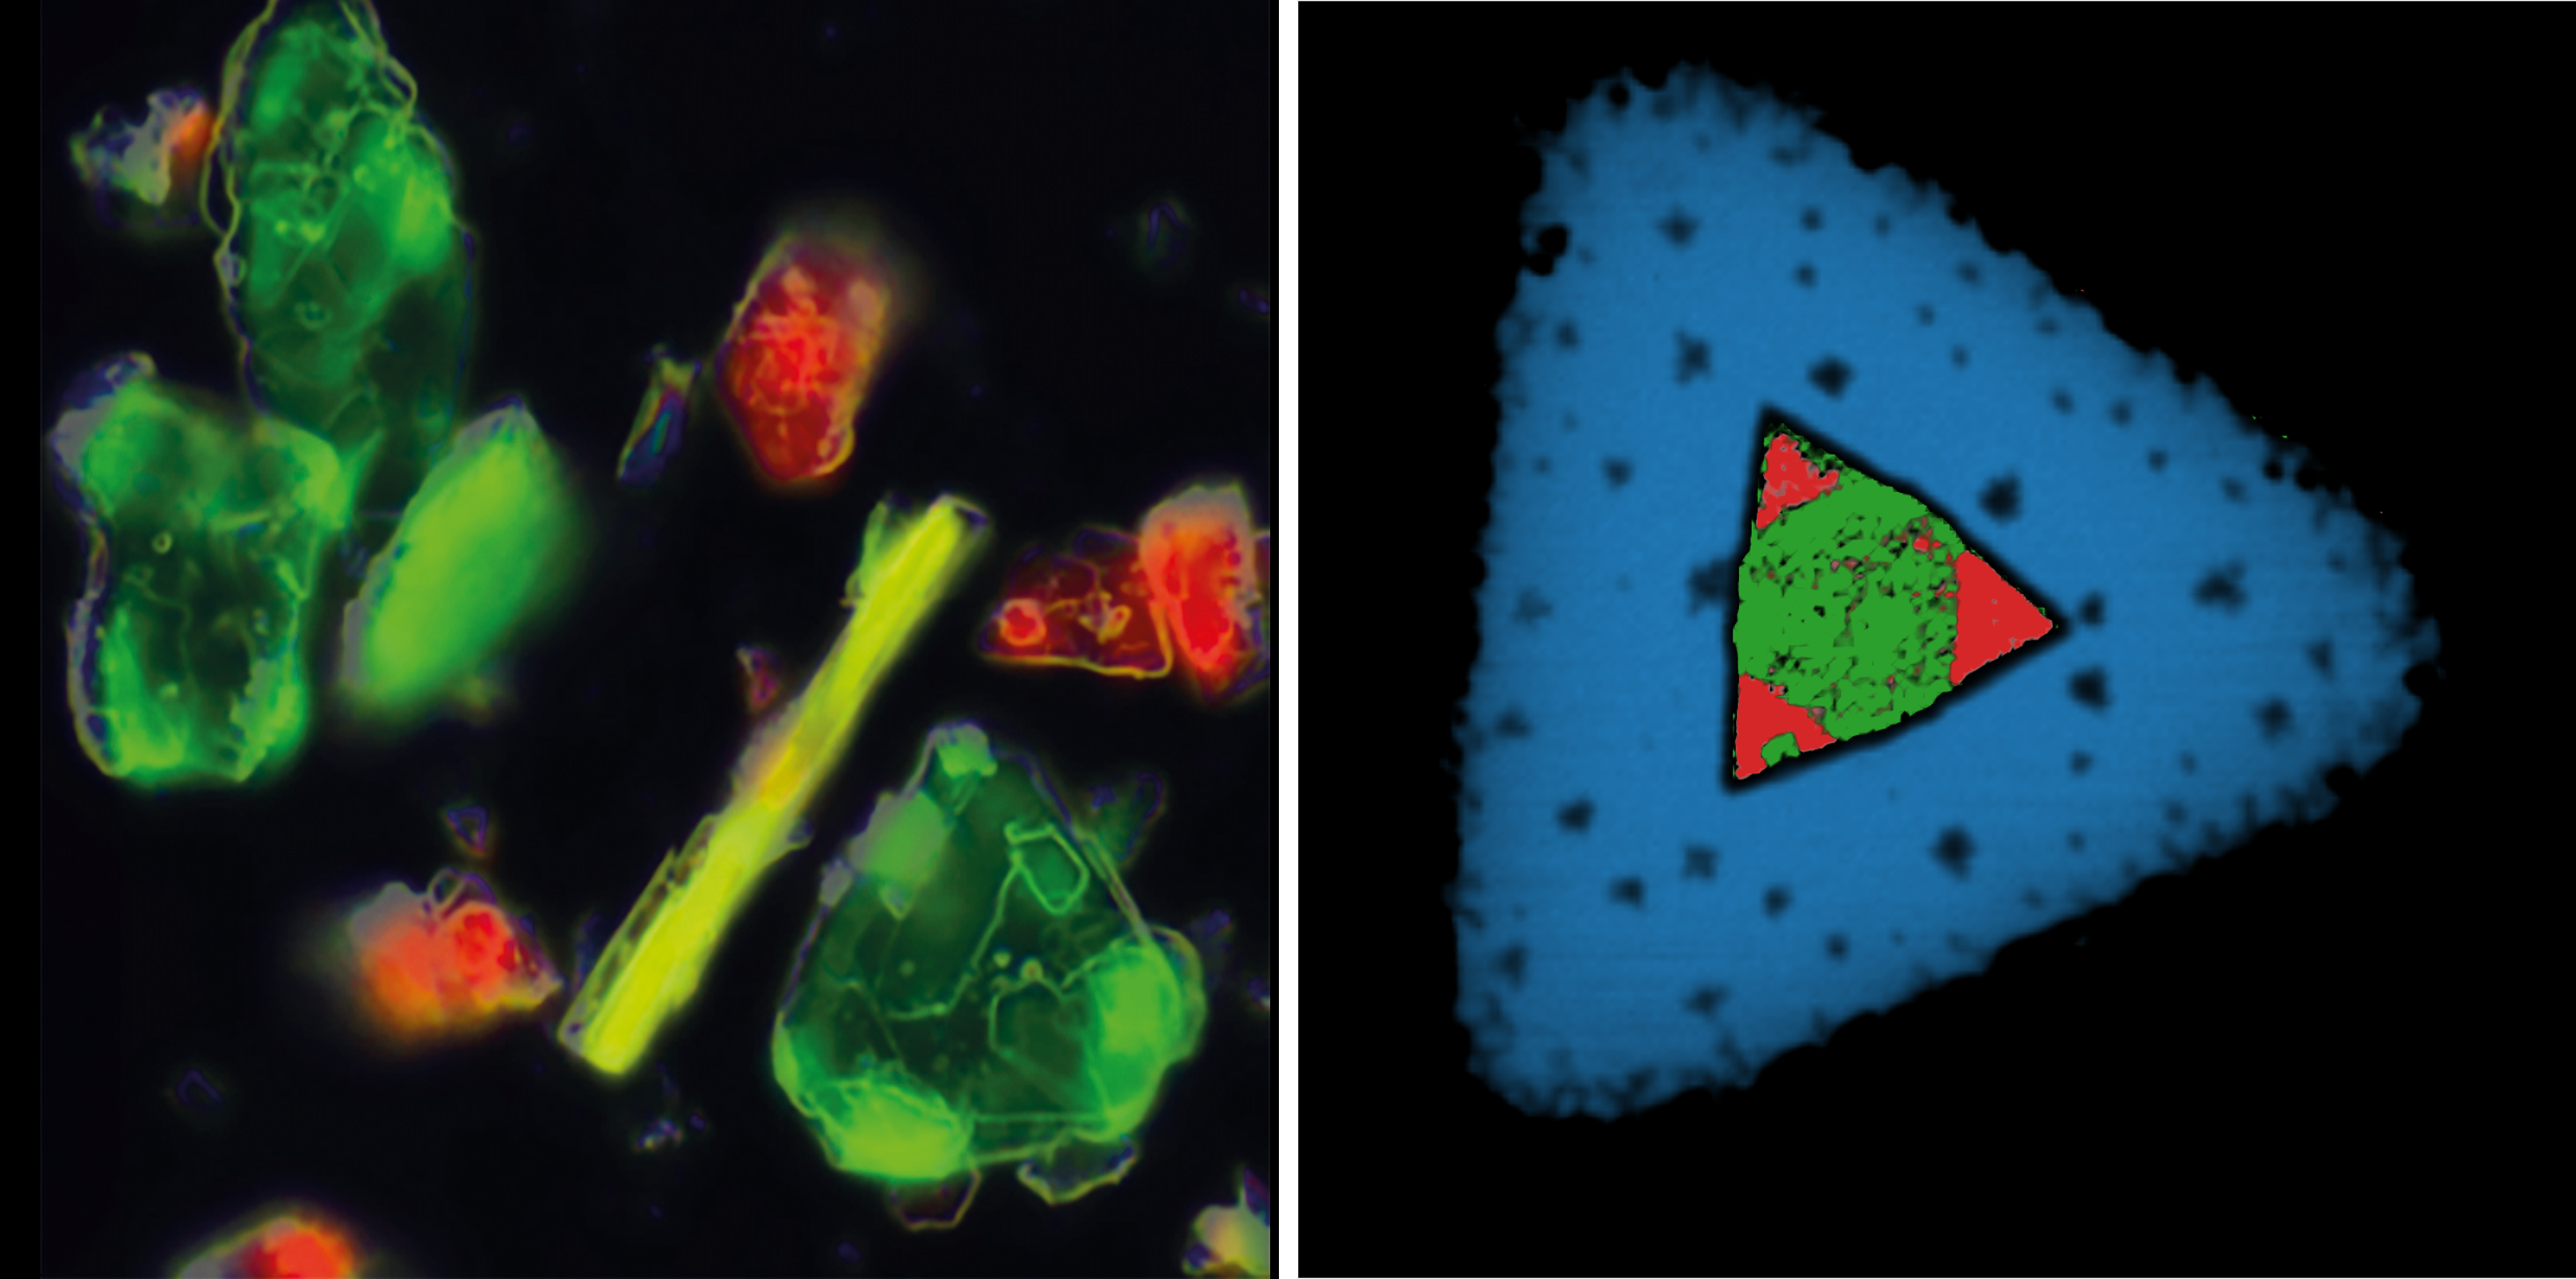
Figure 1. Raman images recorded on Edinburgh Instruments RM5 and RMS1000 Confocal Microscopes. Left: amino acids, and Right: tungsten diselenide crystal.
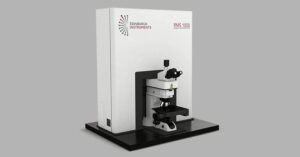
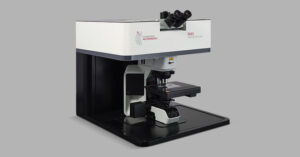
Raman images are acquired using a confocal Raman microscope, Figure 2. The microscope incorporates a laser excitation source, and the beam is focused onto a small spot on the sample using an objective lens. The Raman scattered photons from the sample pass back into the objective and are guided onto a CCD detector.
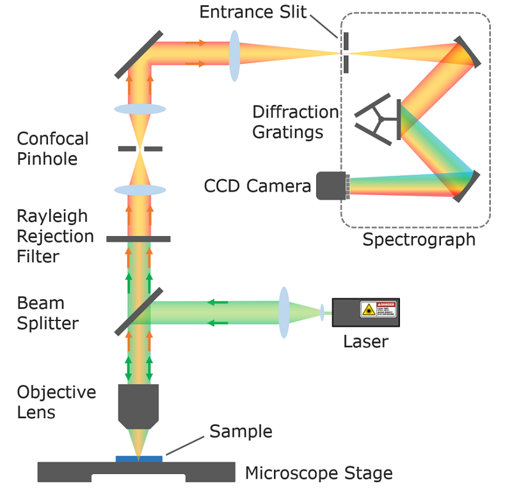
Figure 2. Raman Confocal Microscope.
Imaging is achieved by a motorised microscope stage that can move in X, Y and Z. Images can be recorded by mapping the sample across the X, Y-plane (Figures 1 and 3), throughout an X, Y, and Z-volume (Figure 4) and in X, Y, and Z across an undulating or tilted surface (Figure 4). Each point where a spectrum is recorded is a pixel in the resulting image.

Figure 3. 2D Raman imaging methodology.
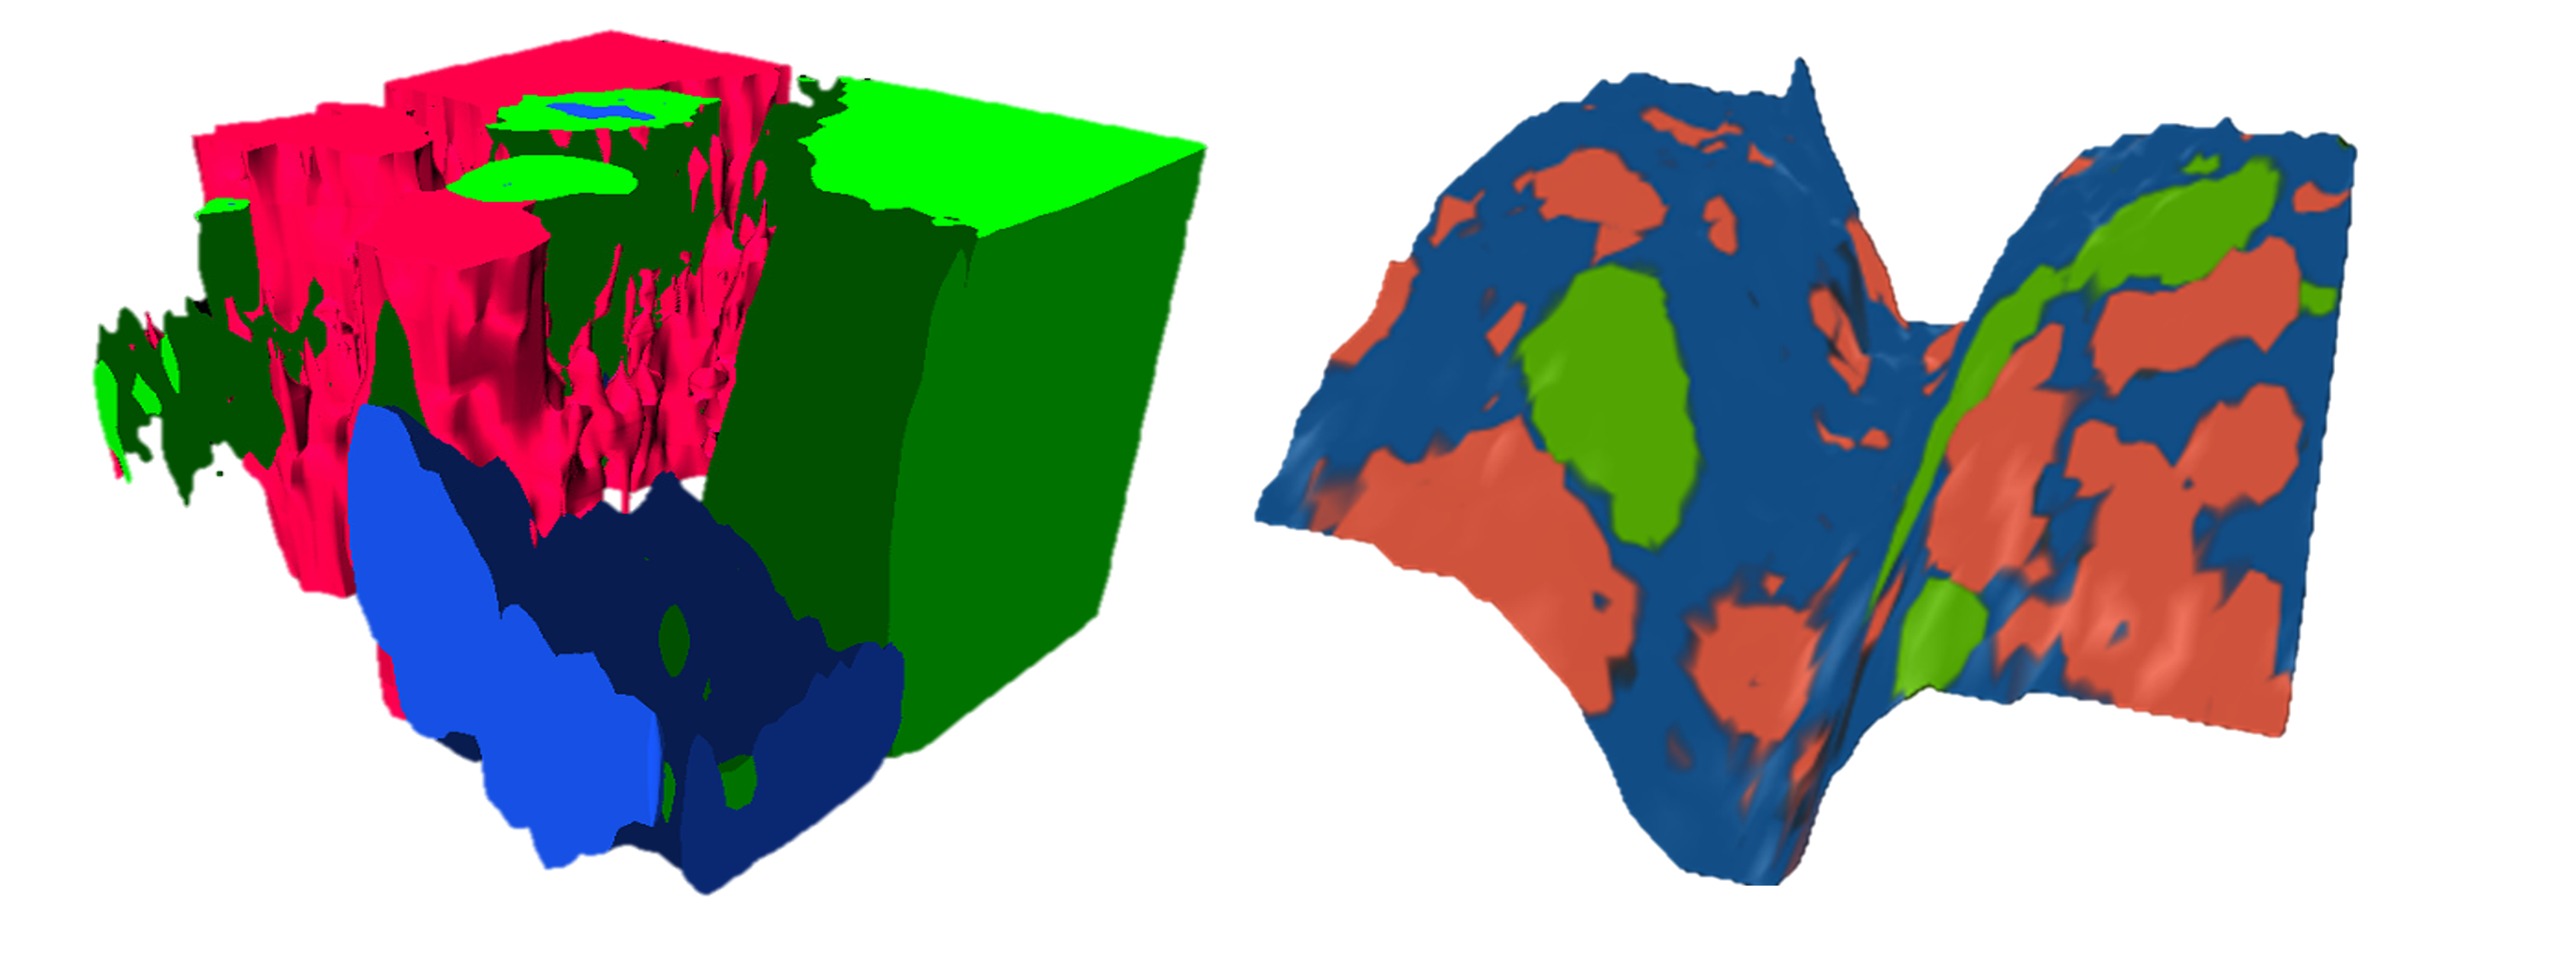
Figure 4. Volumetric Raman image of a geological sample obtained using 3D mapping (left) and surface Raman image of a pharmaceutical tablet using SurfMAP® in Edinburgh Instruments Ramacle software (right).
Multiple parameters from the spectra recorded at each pixel can be used in constructing a Raman image, Figure 5. The main aim of Raman imaging is usually to identify the presence of a material and track its distribution across a sample surface or throughout a volume within the sample. This is possible because different materials have unique Raman spectra that can be used as molecular fingerprints for identification. Since Raman bands are narrow and specific to particular vibrational modes, multiple bands and materials can be imaged simultaneously on a sample. Images can be built using the intensity, position, and width of Raman bands, which can track material concentrations, strain, and crystallinity, respectively. Functions that score spectra based on similarities using chemometric techniques can also be used in Raman imaging. In 2D quantum materials like graphene, peak intensity ratios can be used to image layer number, Figure 6.

Figure 5. The information that can be obtained from Raman imaging.

Figure 6. Strain image of silicon built using peak position analysis (left) and graphene layer image made using ratiometric analysis (right).
If you would like further information on how the RM5 and RMS1000s Raman Microscope can be used to help you with your research, contact us.
If you have enjoyed this blog and want to keep up to date with our Raman images, sign up for our monthly eNewsletter below for further updates on our latest research, application notes and products.