Luminescent optical probes based on lanthanide chelates have attracted particular attention over the last decades in the biomedical field due to their versatile magnetic and photoluminescent properties. Lanthanides exhibit large Stokes shifts and therefore, reabsorption effects can be avoided. Their narrow emission bands allow for excellent spectral discrimination, they are resistant to photobleaching, and time-resolved detection can be facilitated thanks to their long photoluminescence lifetimes in the millisecond time regime. These characteristics make lanthanides useful for numerous applications. These include their broad employment in molecular imaging, such as in magnetic resonance imaging (MRI) as contrast agents.1 Lanthanide nanoparticles have been widely used in high-sensitivity immunoassays2,3 as well as in the detection and imaging of fingerprints.4
In photoluminescence imaging, the downside of lanthanides is that they have weak absorption, limiting the emission’s brightness. They are therefore usually excited through chelated ligands that act as absorption enhancers and transfer the excitation to the lanthanide. Diethylenetriaminepentaacetic acid (DTPA) is a common chelating ligand for metal ions. The covalent attachment of the sensitising chromophore carbostyril 124 (cs124) to the DTPA to form DTPA-cs124 results in a chelating ligand with strong absorption in the UV to enhance lanthanide luminescence via energy transfer (Figure 1).

Figure 1 Schematic illustration of the energy transfer from the ligand to the lanthanide ion (Ln3+).
In this application note, an Edinburgh Instruments FS5 Spectrofluorometer is used for a complete characterisation of the photoluminescence properties of Gd3+, Eu3+, and Tb3+ lanthanide complexes with DTPA-cs124.
Four samples were investigated: Gd3+, Eu3+, and Tb3+ complexes with DTPA-cs124 and the ligand DTPA-cs124 on its own with no metal ion. The samples were dissolved in deionised water to produce solutions of absorbance values between 0.1 and 0.15 at the excitation wavelengths to minimise inner filter effects. The spectral and quantum yield measurements were conducted using the main excitation source of the FS5 Spectrofluorometer (Figure 2), a 150 W Xenon lamp. The samples were held in the SC-05 Cuvette Holder Module for the photoluminescence spectra and SC-30 Integrating Sphere for the quantum yield measurements. The FS5 was equipped with time-correlated single photon counting (TCSPC) and multichannel scaling (MCS) single photon counting electronics for measuring fluorescence and phosphorescence lifetimes, respectively. The TCSPC excitation source was a 340 nm picosecond pulsed LED (EPLED-340) and the MCS excitation source was the FS5’s built-in microsecond Xenon flashlamp. The FS5 was equipped with a PMT-980 photodetector for photoluminescence detection

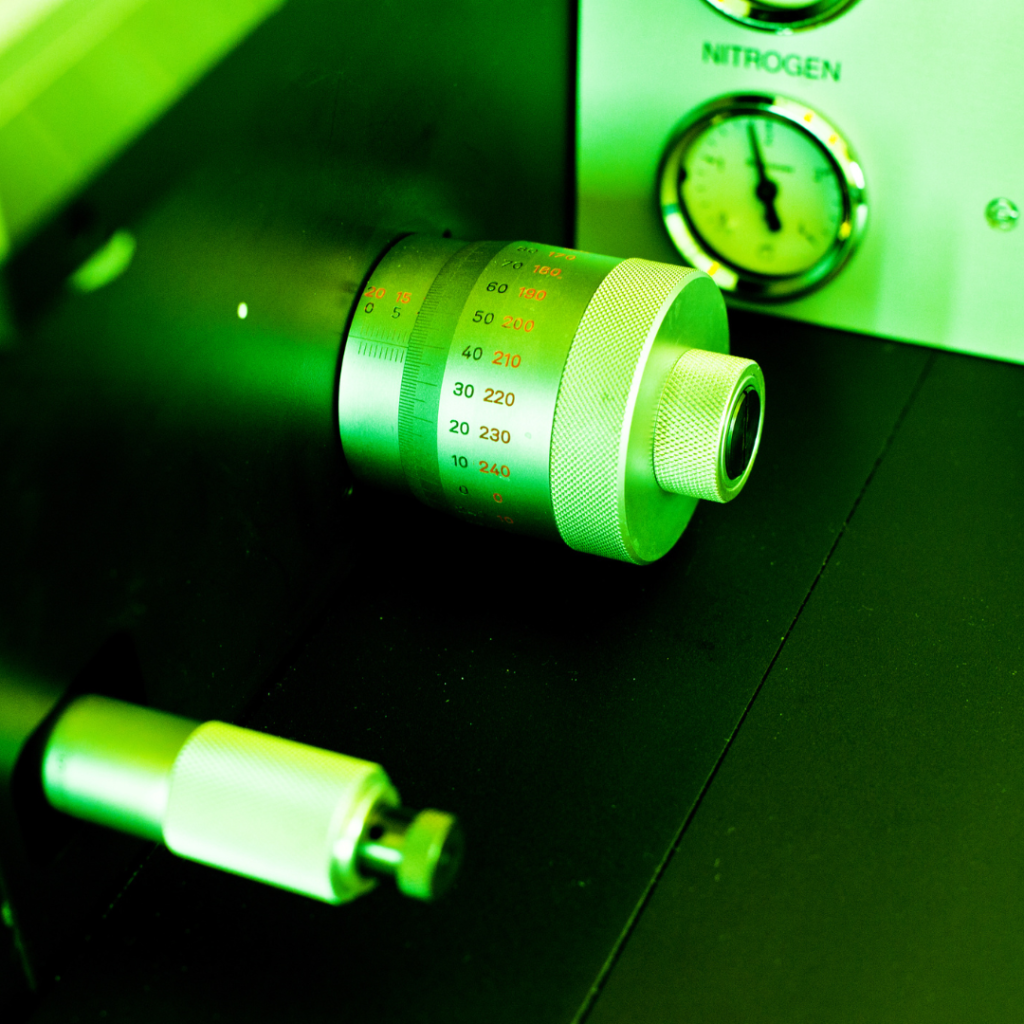
Figure 2 Edinburgh Instruments FS5 Spectrofluorometer.
Firstly, the absorption spectra of all samples were measured using the FS5’s built-in transmission detector (Figure 3). Figure 3 shows that the absorption properties of the lanthanides reflect their ligand (DTPA-cs124) and not the lanthanides themselves.5

Figure 3 Absorption spectra of all samples.
Next, the emission spectra of all lanthanide complexes and their ligand were acquired. The Tb3+ and Eu3+ complexes were excited at 320 nm and 300 nm, respectively, and Figure 4 shows the emission spectra of the lanthanide complexes showing the energy transfer from the ligand to the lanthanide ion. The emission spectra of Tb3+ (Figure 4, top, in blue) and Eu3+ (Figure 4, bottom, in green) complexes are characterised by narrow emission bands (between 480 nm and 720 nm) that were successfully resolved by setting low emission bandwidth on the emission monochromator (Δλem=0.8 nm), step size=0.2 nm and dwell time=0.2 s for Tb3+ complex and 1 s for Eu3+ complex. Their spectra also revealed a broader emission band within the 345 nm – 450 nm regime which is the direct DTPA-cs124 emission.


Figure 4. Top: Emission spectrum of the Tb3+ complex. Its narrow emission peaks are zoomed-in for better resolution. Bottom: Emission spectrum of the Eu3+ complex along with its well-resolved narrow emission bands.
Figure 5 shows the emission of Gd3+ complex and DTPA-cs124. It can be seen that their emission spectra are similar showing that the energy transfer from the ligand to the metal ion is insufficient to excite Gd electrons, resulting in non-radiative decay.6

Figure 5 Normalised emission spectra of Gd3+ and DTPA-cs124.
The change in the lifetime of the direct DTPA-cs124 ligand fluorescence when chelated with the different lanthanides was then investigated using TCSPC. The monochromator’s emission wavelength was set at the low emission bands of all samples (360 nm – 380 nm), where the fluorescence of DTPA-cs124 and the energy transfer from the ligand to the metal complexes occur.
The decays were fitted using the reconvolution fitting feature of the FS5’s Fluoracle® software as a reconvolution of the instrument’s response (IR) of the detector and the exponential decay of the samples. Table 1 summarises the TCSPC measurements and Figures 6a to 6d show the graphs of the fast decays along with their fits and the IR pulse of each measurement. The excitation source was a picosecond pulsed LED (EPLED-340) with a central emission wavelength at λex=340.7 nm and a 20 MHz repetition rate. The TCSPC data shows that the lifetime of DTPA-cs124 decreases from 512 ps to 443 ps when complexed with Gd3+, 351 ps when complexed with Tb3+, and 431 ps when complexed with Eu3+. This demonstrates that the energy transfer between the ligand and the lanthanide ions occurs.
Table 1 Summary of the TCSPC measurements.
| Sample | Lifetime (ps) | Std dev (ps) |
|---|---|---|
| DTPA-cs124 | 512 | 6.75 |
| Gd3+ | 443 | 2.23 |
| Tb3+ | 351 | 2.45 |
| Eu3+ | 431 | 17.3 |


Figure 6 Lifetime decays in TCSPC mode of (a) DTPA (=512 ps) and (b) Gd3+ (=443 ps), (c) Tb3+ (=351 ps), and (d) Eu3+ (=431 ps). An EPLED-340 was used as the excitation source at a repetition rate of 20 MHz.
The lifetime decays of the lanthanide ions after energy transfer was then measured using MCS mode. Figure 7 shows the slow decays of Tb3+ (in blue) and Eu3+ (in green). A microsecond flashlamp operating at 500 kHz was used as the excitation source.
The decays comprised a single exponential component and were calculated to be 1.48 ms for Tb3+ and 0.6 ms for Eu3+. These values are in close agreement with the literature values of Tb3+ and Eu3+ complexes with DTPA-cs124 which are reported as 1.55 ms and 0.62 ms, respectively.7

Figure 7 Lifetime decays of Eu3+ (green) and Tb3+ (blue), acquired in MCS mode using the microsecond Flashlamp at 500 kHz.
Lanthanide probes of high brightness are highly desirable, and the quantum yield is an important metric since it shows how efficiently a luminescent probe emits light. The quantum yield of all samples was determined using the FS5’s integrating sphere (SC-30) and calculated through the built-in quantum yield wizard of Fluoracle®. The measurements comprised two steps: firstly, the emission and scattering of the lanthanide complexes and their ligand were acquired. Secondly, it was acquired the emission and scattering of the blank (deionised water). This process was repeated three times for each sample to check the consistency of the results and maintain reliability.
A representative quantum yield measurement of the Tb3+ complex can be seen in Figure 8 where its scattering and emission spectra are shown in blue along with the emission and scattering spectra of the blank (in violet). Both measurements (sample and blank) were performed in the FS5’s integrating sphere.

Figure 8 Example of a Tb3+ complex quantum yield measurement (=29.01%) by using the FS5’s integrating sphere (SC-30). The measurement parameters were λex=310 nm, Δλex=6 nm, Δλem=0.6 nm, step size=0.5 nm, and dwell time=1s.
Table 2 summarises the quantum yield calculations (QY 1 to 3) along with the average quantum yield value of the samples and their standard deviation. The Tb3+ complex was found to have the best quantum yield at 28.35%.
Table 2 Summary of the quantum yield calculations of the lanthanide complexes and their ligand.
| Sample | QY 1 (%) | QY 2 (%) | QY 3 (%) | Average | Std Dev |
|---|---|---|---|---|---|
| DTPA-cs124 | 6.61 | 5.62 | 6.01 | 6.08 | 0.5 |
| Gd3+ | 8.35 | 7.45 | 7.5 | 7.76 | 0.5 |
| Tb3+ | 29.01 | 26.61 | 29.44 | 28.35 | 1.52 |
| Eu3+ | 5.92 | 5.41 | 5.05 | 5.46 | 0.44 |
We are grateful to James A. Tranos and Prof. Youssef Wadghiri of the Centre for Biomedical Imaging at the NYU Grossman School of Medicine in New York, USA, for providing the samples used in this application note. More information can be found in the accompanying paper Rapid In-Vitro Quantification of a Sensitized Gadolinium Chelate via Photoinduced Triplet Harvesting.