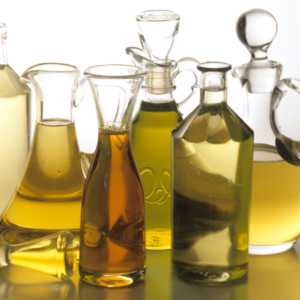
Olive oil has been valued for its culinary and cultural significance for millennia. As one of the most widely consumed edible oils globally, quality standards are defined and monitored by regulatory bodies such as the International Olive Council (IOC). The IOC has defined grades for olive oil based on its quality and purity, with three primary classifications: extra virgin, virgin, and olive oil. Extra virgin olive oil (EVOO) is obtained solely by cold mechanical extraction and is prized for its superior taste, characterised by low acidity. Virgin olive oil, while slightly lower in quality than extra virgin, still maintains significant sensory and nutritional qualities. Olive oil, the most widely available grade, may undergo refining processes and often exhibits a milder flavour profile.
Despite extensive countermeasures, several cases of olive oil fraud are reported each year in Europe.1 These cases commonly involve mixing extra virgin olive oil with a lower-quality edible oil or adding colourants to the olive oil to pass as extra virgin. The integrity of the oil can also be compromised by improper storage and processing. Reliable olive oil analysis methods are essential for ensuring adherence to regulatory standards and gaining consumer trust.
One of the most reliable techniques for assessing the quality of olive oil is UV-visible (UV-Vis) spectrophotometry. This analytical method offers a precise and efficient means of quantifying various compounds present in olive oil, including pigments, phenolic compounds, and oxidation products, by measuring the absorbance of specific wavelengths of light. UV-Vis spectrophotometry only requires a benchtop instrument and almost no sample preparation; therefore, it is an ideal tool for the rapid identification of adulteration or degradation.
In this Application Note, an Edinburgh Instruments DS5 Spectrophotometer is used for the quality assessment of edible oils, including extra virgin, virgin, and lower-grade edible olive oils, following the industry’s standard UV-Vis analysis method. Additionally, a method to quantify olive oil adulteration using its visible absorption spectrum is evaluated.
Commercial edible oils were purchased and used as provided (Figure 1, Table 1). Sample HEVOO was prepared by heating EVOO above its smoke point for a duration of 5 minutes.
Table 1. Edible oil sample contents and their abbreviation.
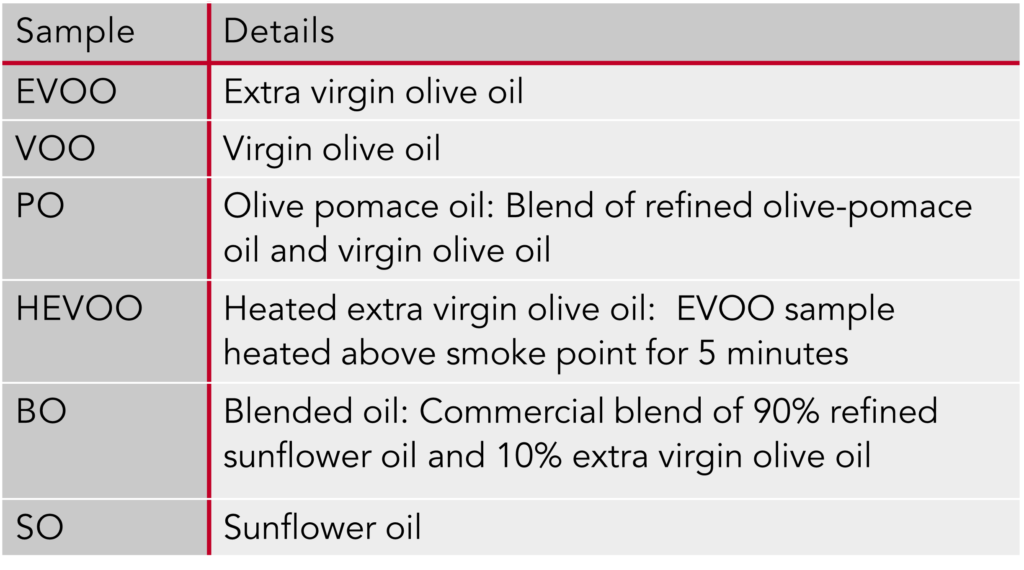
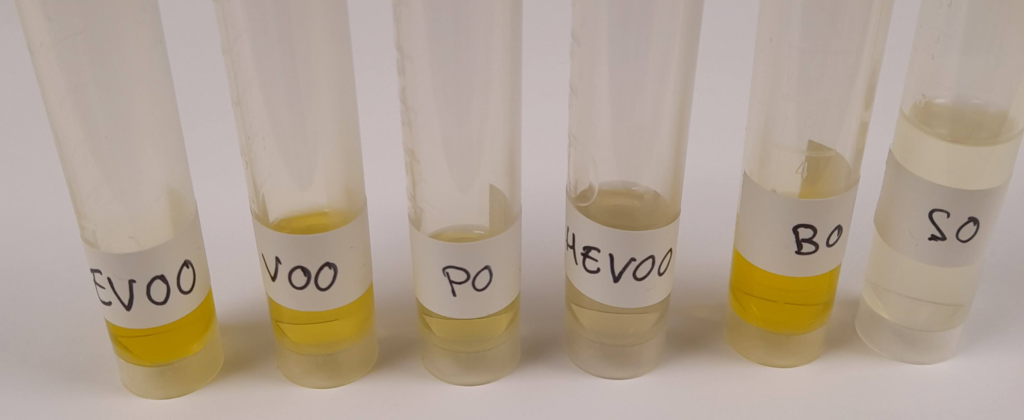
Figure 1. Edible oil samples used in this study.
The quality of samples EVOO, VOO, PO, and HEVOO was assessed using the method established by the International Olive Council.2 The method requires a spectrophotometer which can measure with 1 nm resolution between 220 nm and 360 nm. Linearity, wavelength and photometric accuracy in the UV range must be verified before the measurements. This study employed a DS5 Spectrophotometer (Figure 2). Its performance was validated using holmium oxide and potassium dichromate standards. The samples were diluted in isooctane to a concentration of 1% (m/V), transferred to quartz cuvettes and studied in the DS5 Spectrophotometer after performing a baseline correction.
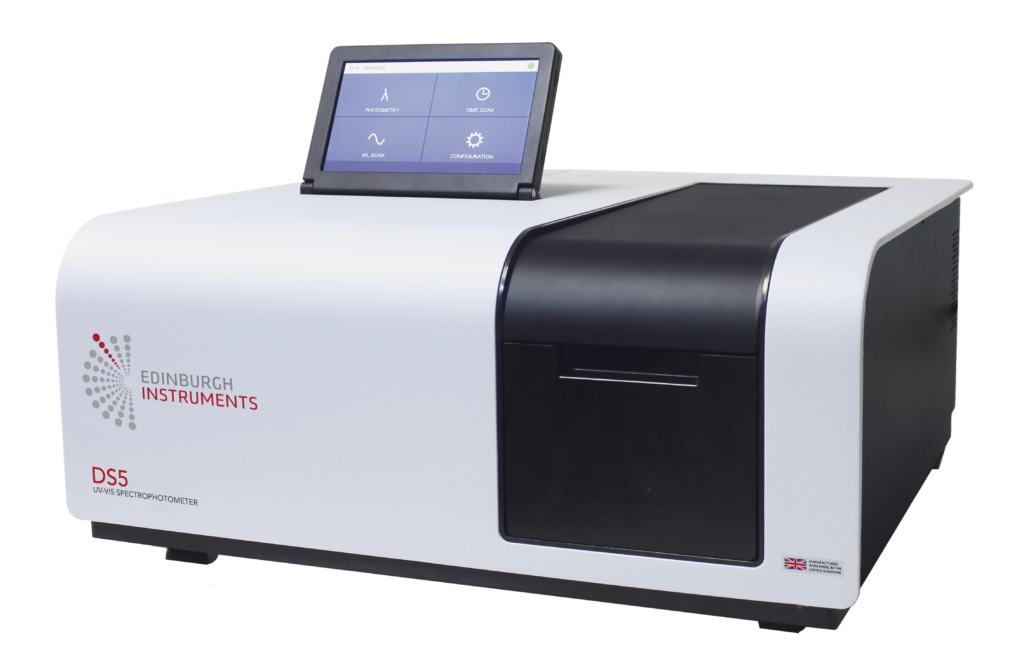
Figure 2. Edinburgh Instruments DS5 UV-Vis Spectrophotometer.
Samples BO, EVOO, SO, and their mixtures were used without further dilution in the quantitative study. They were measured in the DS5 Spectrophotometer after a baseline correction.
The absorbance of each of the samples EVOO, VOO, PO, and HEVOO was measured at 232 nm, 264 nm, 268 nm, and 272 nm. The extinction coefficient Kλ at each wavelength λ was calculated as follows:

where Aλ is the absorption at wavelength λ, c is the concentration in g/100 mL, and l is the path length of the cell in cm. The variation of extinction coefficient ΔK was given by the values at 264, 268, and 272 nm:

The resulting values are presented in Table 2, expressed to two decimal places as indicated by COI.
Table 2. Extinction coefficients and ΔK values for the olive oil samples studied.

The quality criteria for different types of olive oil are as follows:3
Table 3. Olive oil UV absorption quality criteria according to the IOC.

Comparing Tables 2 and 3, samples EVOO, VOO, and PO meet the quality criteria specified for their oil category. Sample HEVOO does not meet the standard for extra virgin olive oil, showing that just 5 minutes at high temperature degrades the quality of the oil dramatically. As the oil is heated, oxidation accelerates, and UV-absorbing compounds are formed.
While single-wavelength UV absorption is an established trade standard for assessing olive oil, a scanning spectrophotometer provides additional functionality for developing methods of analysis. If adulteration with other oils is suspected, the ability to acquire the full UV-Vis spectrum is of invaluable help in identifying the adulterant. UV-Vis absorption can also yield quantitative information on the adulterant. For example, extra virgin olive oil has a high content of chlorophyll and carotenoids which absorb between 400 nm and 700 nm. Refined sunflower oil, in contrast, does not contain high concentrations of visible-absorbing compounds. This is observed in the UV-Vis spectra of EVOO, SO, and BO in Figure 3.
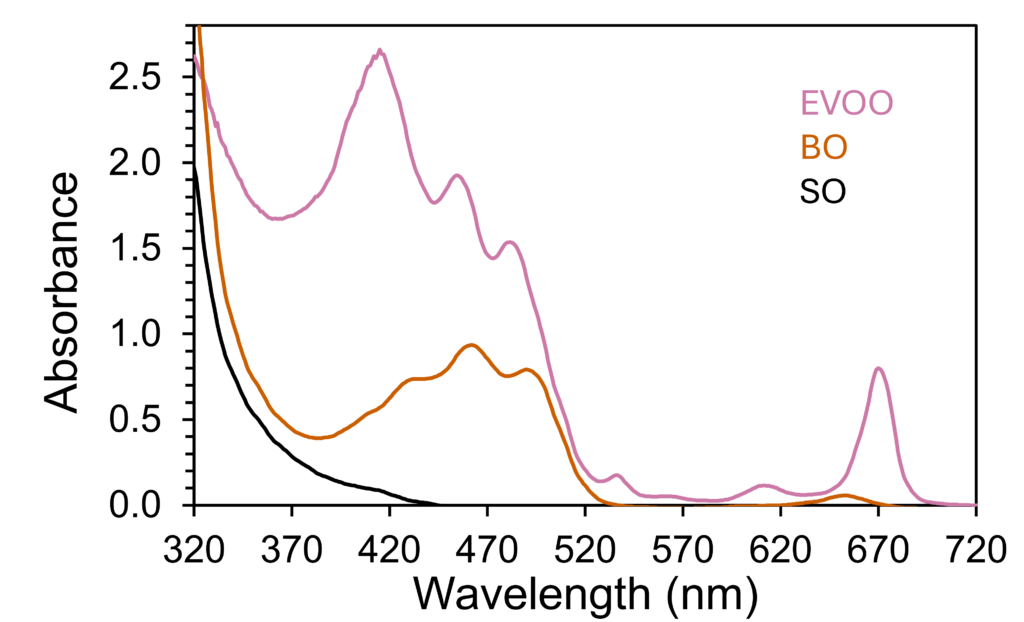
Figure 3. UV-vis absorption spectra of undiluted EVOO, BO, and SO acquired in the DS5 Spectrophotometer.
One method proposed in the literature used the absorption of neat oil at visible wavelengths to quantify the adulteration of extra virgin olive oil with other vegetable oils.4 To test the effectiveness of this method, mixtures of EVOO and SO in eight different proportions (Table 4) were measured at 455 nm. A calibration curve for absorption against concentration was created using the quantitation wizard in the DS5 Visacle software. The resulting curve follows the equation y = 0.0015 + 0.0198x, where y is the absorbance at 455 nm and x is the concentration of EVOO in % weight. The DS5 provides a linear response even at high absorbance.
Table 4. Mixtures of EVOO and SO (% weight) used for the calibration curve.

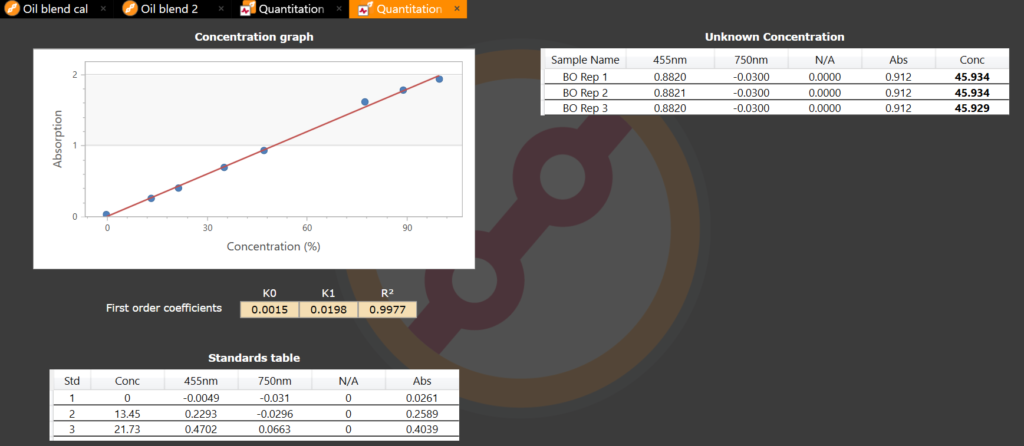
Figure 4. Visacle spectrophotometer software showing the EVOO/SO calibration curve.
A mixture with 14% EVOO was prepared and measured at 455 nm, with the calibration curve affording a result of 12% EVOO. While this result may be acceptable, when a commercial blend (sample BO) of 90% extra virgin olive oil and 10% refined sunflower oil was measured, the curve predicted a concentration of 45% extra virgin olive oil. This suggests that the oils in BO possess significantly different absorption spectra from those in the calibration set, which could be due to a different level of refinement. The result highlights that, for the quantitation to be meaningful, the analyst must calibrate using the same oils that are present in the blend.
The DS5 Spectrophotometer not only allows routine analysis of olive oil quality, but it also enables investigations on new methods thanks to functionality like spectral acquisition and quantitation curves.
