The design of circularly polarised luminescence (CPL) phosphors is attracting increasing interest for a wide range of applications, including security devices and inks. Lanthanide complexes are ideal candidates for obtaining efficient CPL emission as they possess large dissymmetry factor (gEm or glum). In addition, CPL phosphors for use in security devices must possess good thermal stability, photostability and be relatively inexpensive to produce.
This Research Highlight discusses work published in Inorganic Chemistry by researchers at University of Verona, Italy.1 The presented study describes the design of new chiroptical inorganic phosphor materials whose CPL signature can be modified by simply changing the Tb3+/Eu3+ molar ratio within the compound (Figure 1). This is attractive for designing new and tuneable materials as security inks for anticounterfeiting applications, as the different ratios create unique optical fingerprints.
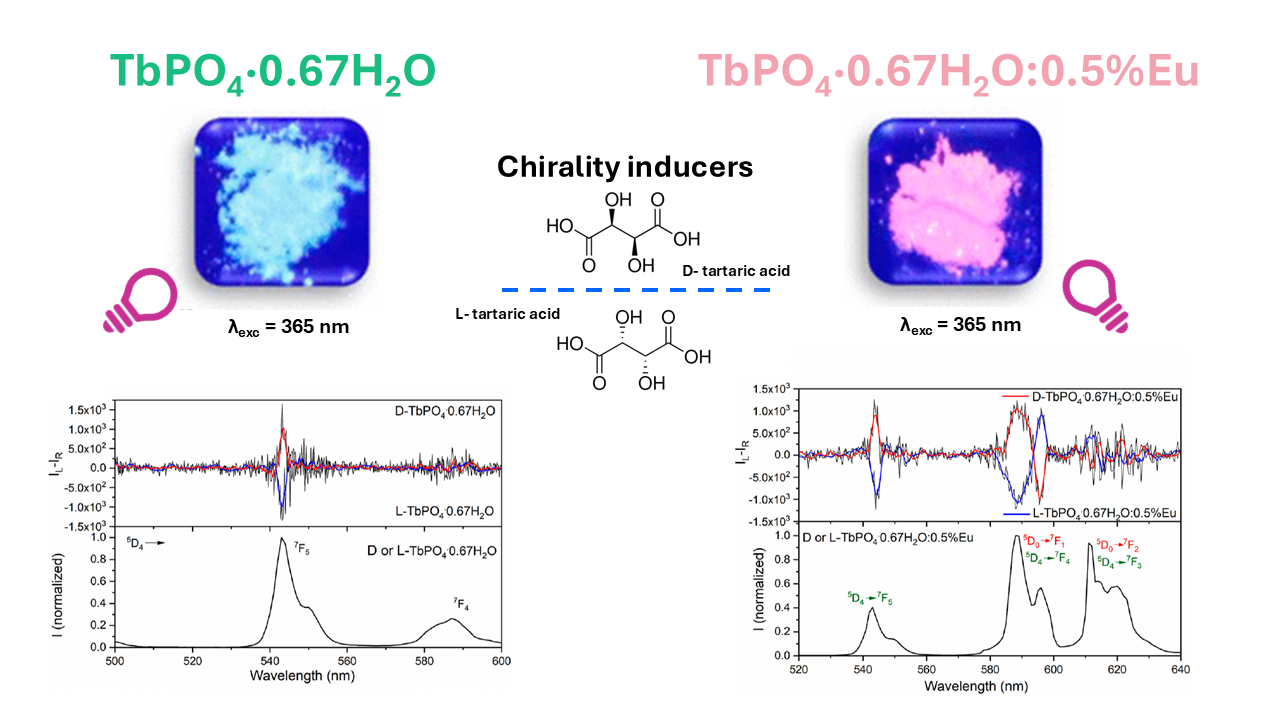
Figure 1. Lanthanide nanocrystal powders were synthesised to exhibit unique CPL properties. The image is reproduced from F. Piccinelli et al.1, Copyright (2024), with permission from the American Chemical Society.
In this work they used an Edinburgh Instruments FLS1000 Photoluminescence Spectrometer for full spectroscopic characterisation of their synthesised material, including excitation, emission, luminescence decay and CPL measurements.
In this research, chiroptical TbPO4·nH2O nanocrystals were investigated. Steady state and time-resolved photoluminescence of the sample were collected using an FLS1000 Photoluminescence Spectrometer with continuous and pulsed Xenon lamp excitation sources (Figure 2). The FLS1000 had a double excitation monochromator and a single emission monochromator. CPL spectra were collected using the CPL Upgrade on the FLS1000.
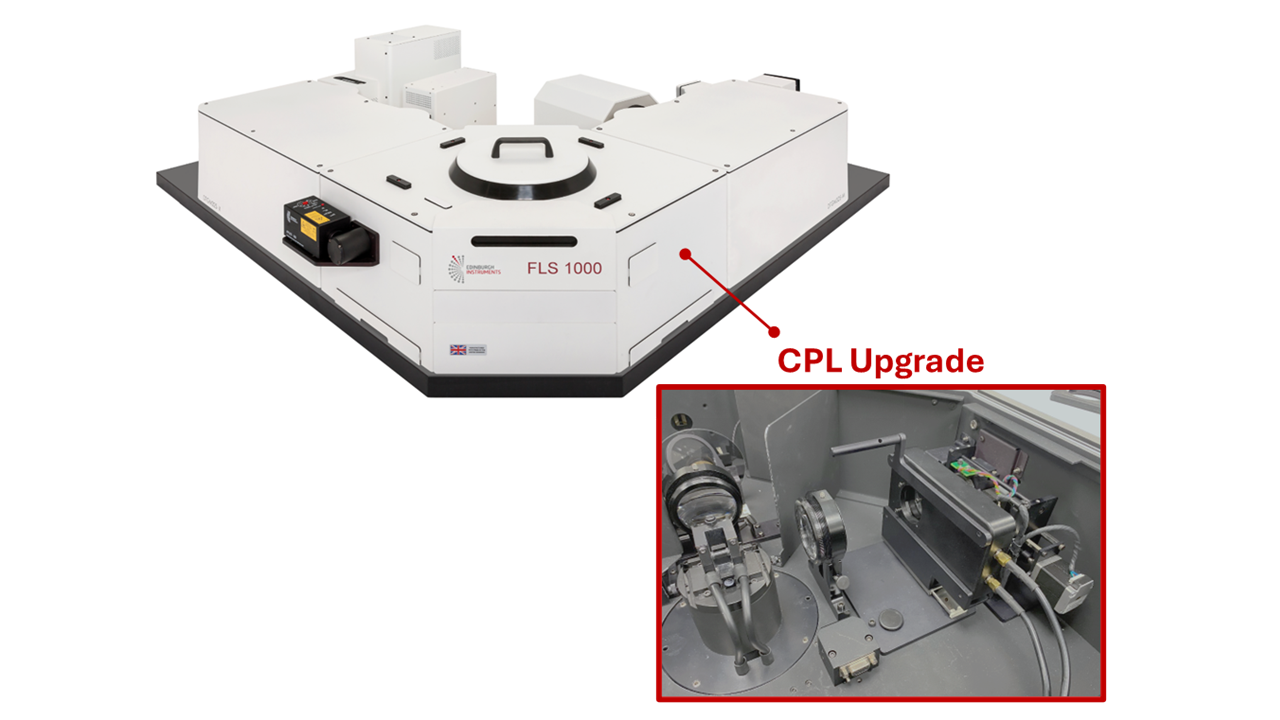
Figure 2. Edinburgh Instruments FLS1000 Photoluminescence Spectrometer. CPL upgrade for FLS1000 shown in inset photo.
First, the researchers investigated the effect of Eu doping on the excitation and emission spectra. The FLS1000 was used to characterise the photoluminescence properties of two representative samples: TbPO4·0.67H2O and TbPO4·0.67H2O:0.5%Eu (Figure 3).
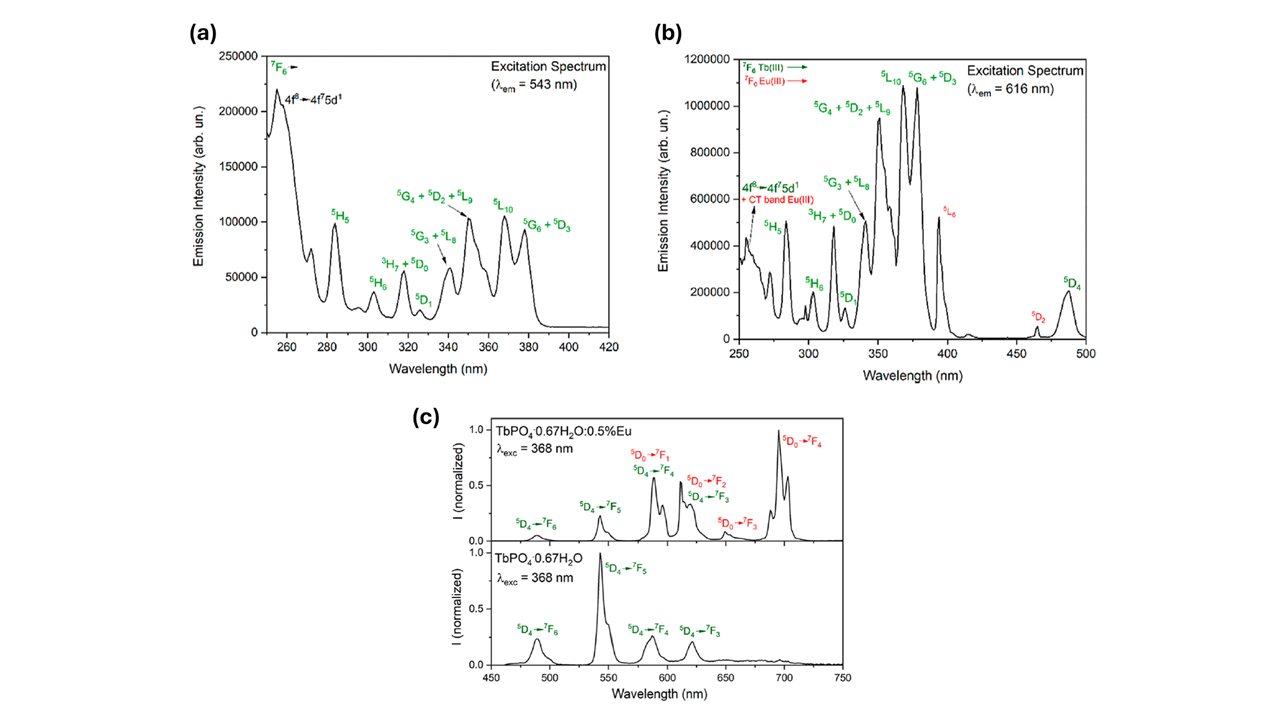
Figure 3. Excitation spectra of (a) TbPO4·0.67H2O and (b) TbPO4·0.67H2O:5%Eu nanocrystals. Emission spectra of (c) TbPO4·0.67H2O (bottom) and TbPO4·0.67H2O:0.5%Eu (top) nanocrystals. The image is reprinted from F. Piccinelli et al.1, Copyright (2024), with permission from the American Chemical Society.
The excitation spectrum of TbPO4·0.67H2O showed bands from 280 to 400 nm, typical of f-f intra-configurational bands of the Tb3+ ion. The same excitation peaks were present in the Eu3+ doped sample (TbPO4·0.67H2O:5%Eu), but additional peaks at 395 and 465 nm corresponding to f-f transitions of Eu3+ were also observed. These additional peaks demonstrate that a Tb3+ → Eu3+ energy transfer process takes place in the Eu3+ doped sample.
The emission spectra showed TbPO4·0.67H2O exhibited typical f-f Tb3+ emission originating from the 5D4 excited level (Figure 3c – bottom). In contrast, the emission of the Eu doped sample was due to both Tb3+ and Eu3+ emission lines (Figure 3c – top). The dominant emission feature of Eu3+ was the 5D0 → 7F4 band at 700 nm.
Lifetime measurements of the TbPO4·0.67H2O nanocrystal sample were acquired using the FLS1000 pulsed Xenon lamp excitation source. Luminescence decay curves of TbPO4·0.67H2O with increasing ratio of Tb3+/Eu3+ are shown in Figure 4.
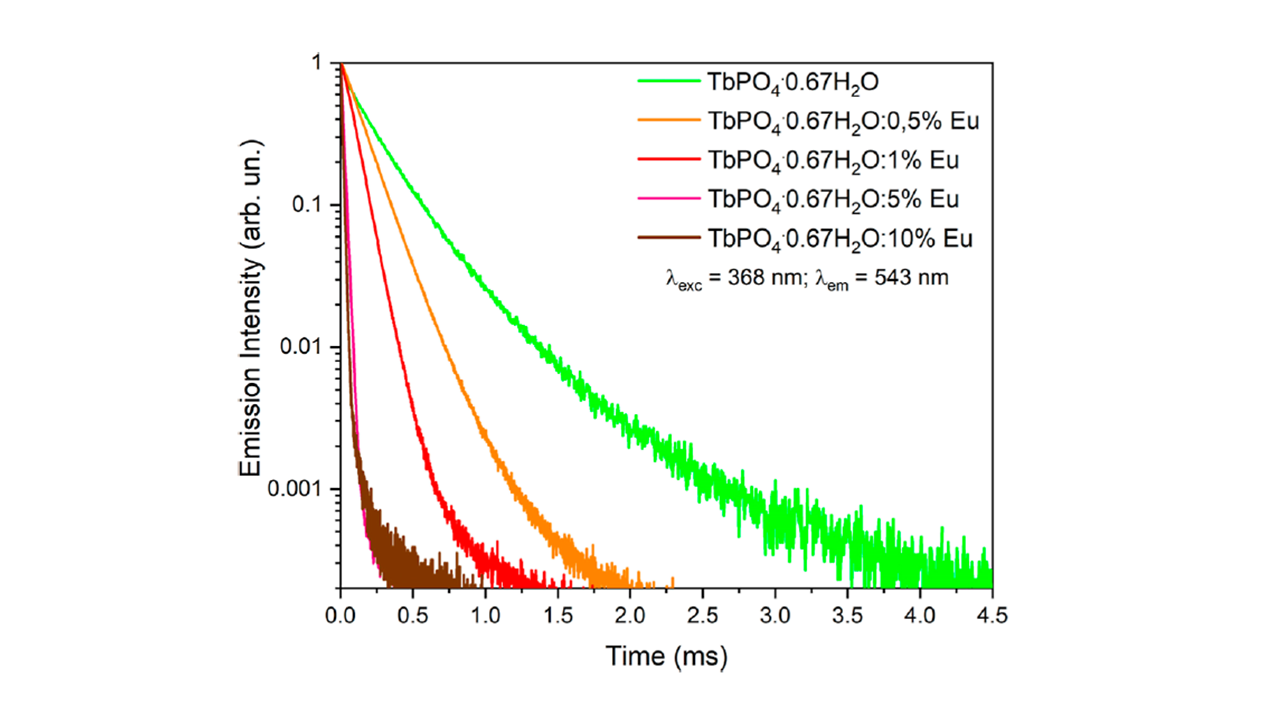
Figure 4. Luminescence decay curves of the Tb3+5D4 excited stated for the TbPO4·0.67H2O:x%Eu (with x = 0, 0.5, 1, 5 and 10) nanocrystals. The image is reprinted from F. Piccinelli et al.1, Copyright (2024), with permission from the American Chemical Society.
The lifetime measurements showed that as the Eu3+ ion concentration was increased the 5D4 decay of Tb3+ became faster, indicating there was an increase in energy transfer efficiency between Tb3+ → Eu3+. The energy transfer approached 100% when the concentration of Eu3+ ion reached 10%.
Lastly, the researchers used the CPL upgrade for the FLS1000 to investigate the CPL properties of TbPO4·0.67H2O The spectrum of the sample showed two well-defined CPL signals at 545 nm and 590 nm (Figure 5a). Mirror CPL signatures were obtained when crystal growth was driven by two different enantiomers of tartaric acid.
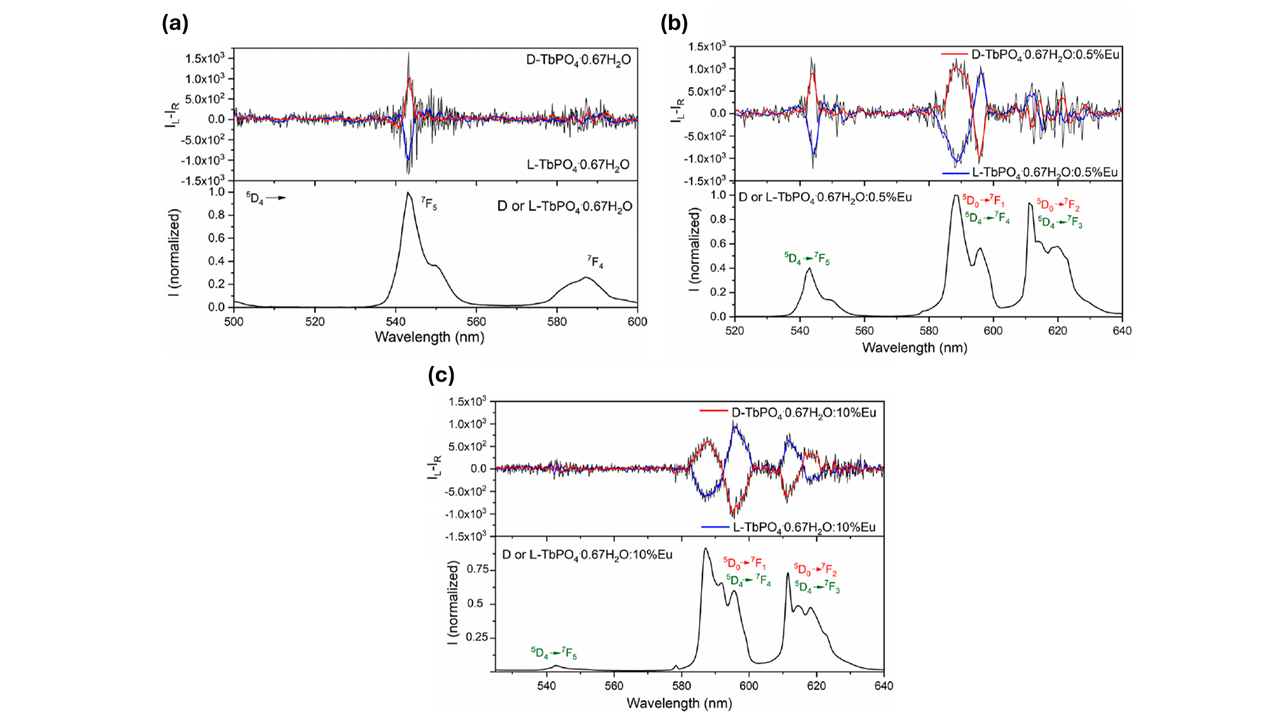
Figure 5. CPL (top) and total luminescence (bottom) spectra of (a) TbPO4·0.67H2O, (b) TbPO4·0.67H2O:0.5%Eu NCs, and (c) TbPO4·0.67H2O:10%Eu nanocrystals with λexc = 368 nm. CPL spectra have been smoothed post-measurement collection. The image is reprinted from F. Piccinelli et al.1, Copyright (2024), with permission from the American Chemical Society.
For the Eu doped sample, the CPL spectrum also showed CPL emission between 580 and 600 nm due to the 5D0 → 7F1 transition of Eu3+; and between 610 and 630 nm where the 5D0 → 7F2 and 5D4 → 7F3 transitions of Eu3+ and Tb3+, respectively, overlap (Figure 5b).
To confirm the tunability of the CPL signal upon changing the Tb3+/Eu3+ molar ratio, the researchers also collected spectra of two enantiomorphic phosphates doped with 10 % mol of Eu3+ (D- and L- TbPO4·0.67H2O:10%Eu) (Figure 5c). Due to the very high Tb3+ → Eu3+ energy transfer efficiency, the main contribution to the CPL was from the Eu3+ ion (580-600 nm and 610-630 nm).
This Research Highlight demonstrates the full characterisation of CPL active lanthanide compounds using an Edinburgh Instruments FLS1000 Photoluminescence Spectrometer with CPL Upgrade. In this work, the authors investigated CPL emission from pure enantiomorphic inorganic compounds, tuned by altering the Tb3+/Eu3+ ratio and controlling the chirality of the synthesis materials.
These materials could be used in security and anticounterfeiting, such as security ink on banknotes. The tuneable nature of the nanocrystals leads to unique optical properties vital for optical counterfeiting applications.
The results in this Research Highlight were published in Inorganic Chemistry. The full article can be found here: https://doi.org/10.1021/acs.inorgchem.4c01869