Extreme fluorescence interference in a sample can hinder Raman microscopy investigations. Using a 1064 nm laser with an InGaAs detector for Raman spectroscopy can supress the problem, but it does come with limitations and trade-offs.
While 785 nm and 830 nm lasers are often sufficient to reduce fluorescence interference, highly fluorescent samples may require the longer wavelength of 1064 nm. However, 1064 nm spectra take longer to acquire due to lower detector sensitivity and weaker Raman scattering at longer wavelengths. The choice of laser wavelength should be carefully considered based on the specific sample and the desired level of fluorescence suppression and signal-to-noise ratio.
In Raman spectroscopy, NIR lasers such as 785 nm, 830 nm, and 1064 nm, are often used to overcome fluorescence interference in Raman measurements. In most cases, 785 nm or 830 nm lasers are sufficient to reduce fluorescence backgrounds and observe Raman bands with a high signal-to-noise ratio. Highly fluorescent samples can still mask Raman signatures at these wavelengths, therefore a 1064 nm laser is necessary (Figure 1).
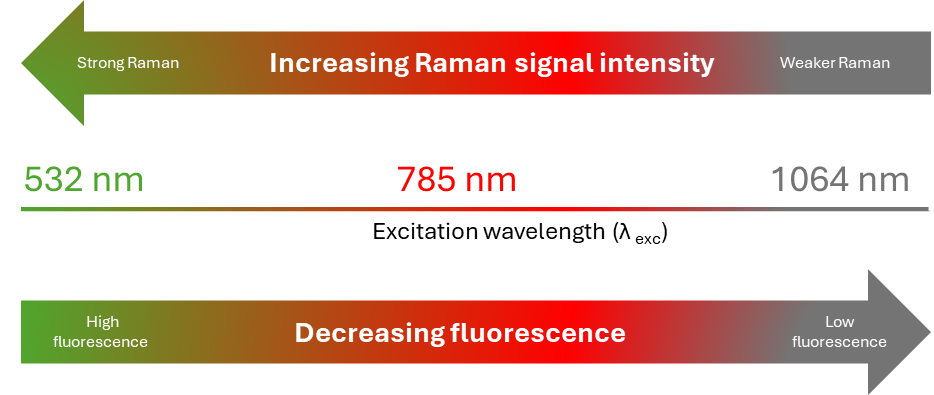
Figure 1. Raman signal intensity strength and the impact of fluorescence emission with respect to laser excitation wavelengths.
Most Raman lasers are used with silicon CCD detectors; however, their quantum efficiency (QE) drops around 1000 nm (Figure 2) and is therefore unsuitable for 1064 nm excitation. When using a 1064 nm laser, an InGaAs detector must be used, which is an NIR-sensitive detector with photosensitivity up to 1650 nm.
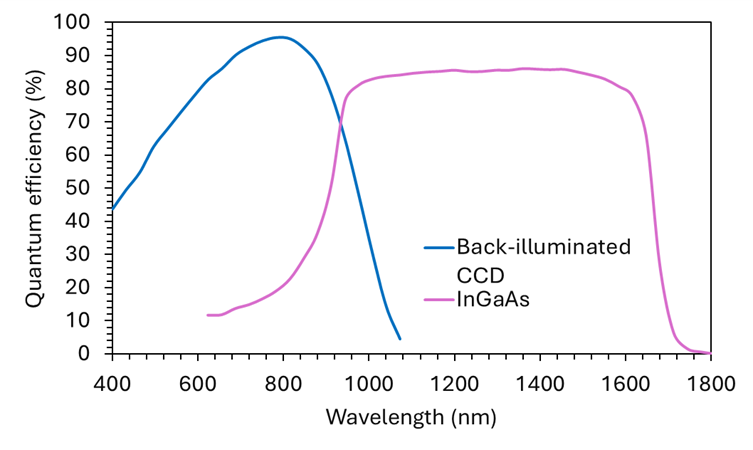
Figure 2. Quantum efficiency plot for back-illuminated CCDs (blue trace) and InGaAs detectors (pink trace).
In this technical note, we compares the performance of a 1064 nm laser with an InGaAs detector against 532 nm and 785 nm lasers with a CCD detector, specifically with respect to fluorescence suppression and detection sensitivity.
A 1064 nm laser with InGaAs detector is recommended when measuring samples that exhibit extreme fluorescence backgrounds when excited with all other lower wavelength lasers. Common samples where this can occur are dyes, pigments and oils.
In Figure 3, three examples of extreme fluorescence interference are demonstrated. In all samples, excitation at 532 nm failed to show Raman signatures because the spectra were dominated by strong fluorescence. Raman information was observed at 785 nm, but the bands occurred on top of high baselines caused by the tail of fluorescence bands. Only when using 1064 nm laser excitation did clear Raman signatures appear without interference from background fluorescence.
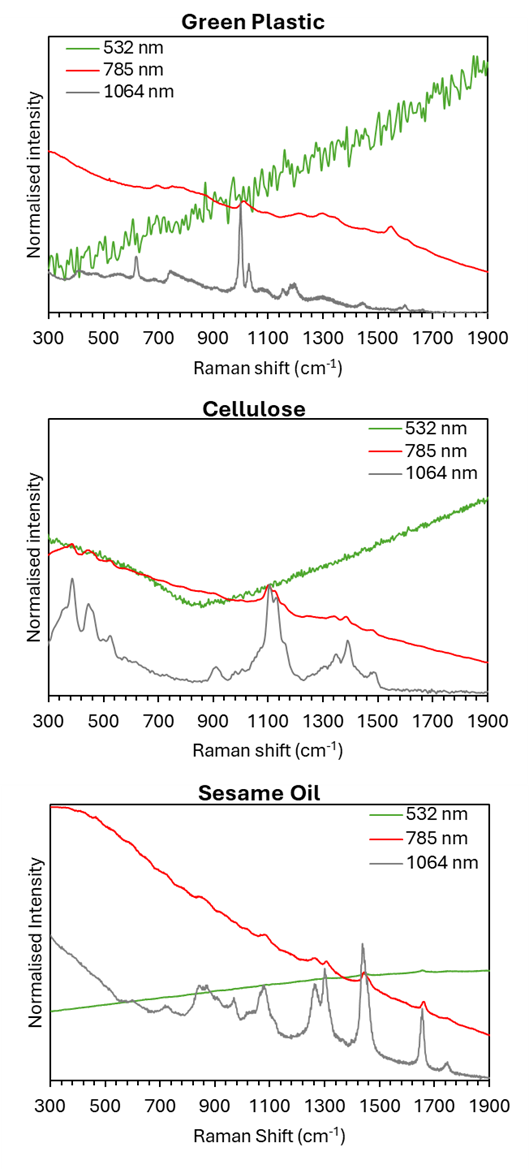
Figure 3. Normalised Raman spectra of plastic, cellulose and sesame oil samples acquired using 532 nm (green traces), 785 nm (red traces), and 1064 nm (grey traces) laser excitations.
Raman scattering intensity is proportional to λ-4, therefore increasing the laser wavelength reduces the Raman scattering intensity. This, combined with the lower sensitivity of the InGaAs detector, means that 1064 nm Raman spectra require significantly longer acquisition times to achieve the same signal to noise. This is particularly important for Raman mapping, where the acquisition time per point should be kept as short as possible to acquire detailed chemical images quickly.
For many samples, the fluorescence suppression provided by the 1064 nm laser does not justify the lower sensitivity and longer acquisition times. To demonstrate this, an aspirin tablet was analysed at 532 nm, 785 nm, and 1064 nm (Figure 4).
Although the 532 nm and 785 nm spectra display a fluorescence background, the observed spectra still clearly show the Raman signatures of aspirin. Post-processing background subtraction can be performed in Ramacle® to remove the underlying fluorescence backgrounds and obtain high signal-to-noise Raman spectra.
Figure 4B displays the post-processed, background subtracted spectra for aspirin. Spectra for 532 nm and 785 nm show no background fluorescence and exhibit the same Raman bands as seen in the 1064 nm spectrum, which took considerably longer to acquire. This aspirin sample is indicative of many intermediately fluorescent samples where utilising background subtraction or using 785 or 830 nm lasers is recommended over 1064 nm.
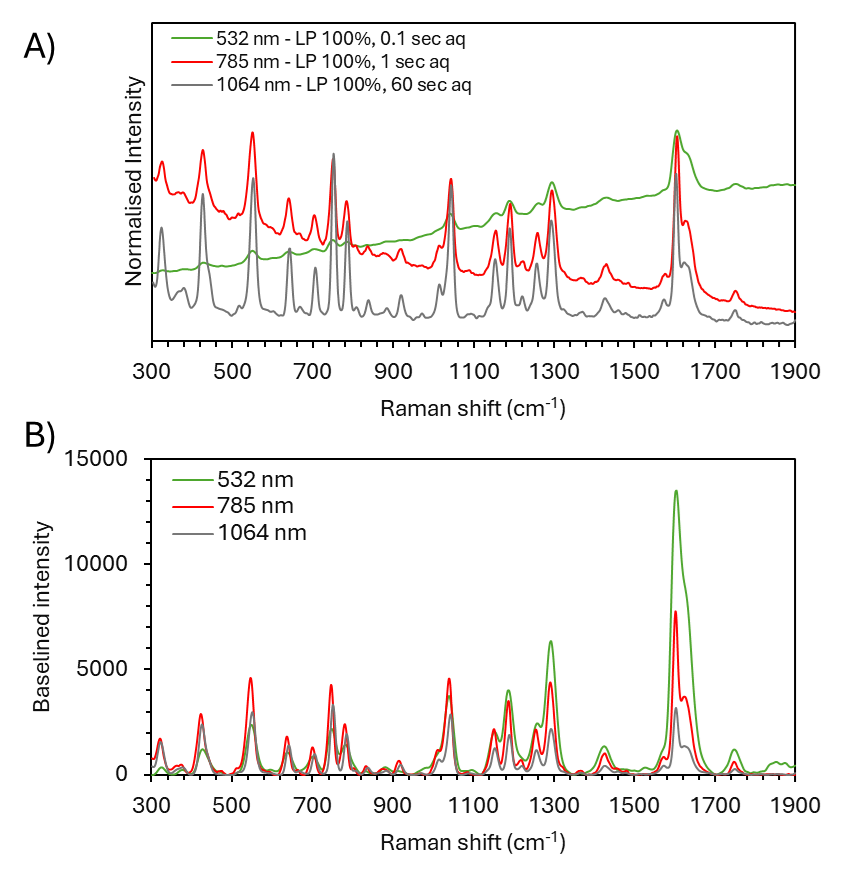
Figure 4. A) Normalised Raman spectra of aspirin acquired using 532 nm (green trace), 785 nm (red trace), and 1064 nm (grey trace) laser excitation. B) Background-subtracted spectra demonstrating sensitivity differences.
To quantify the difference in sensitivity between the 532 nm, 785 nm and 1064 nm lasers, a non-fluorescent cyclohexane sample was measured. Figure 5A demonstrates the effect of laser wavelength on Raman scatter intensity. The intensity difference between the three wavelengths, using the same 5-second acquisition time, is significant. Focusing on the 802 cm-1 ring breathing mode, 532 nm gave 51 times stronger signal intensities compared to 532 nm, and 25 times more for 785 nm (Figure 5B).
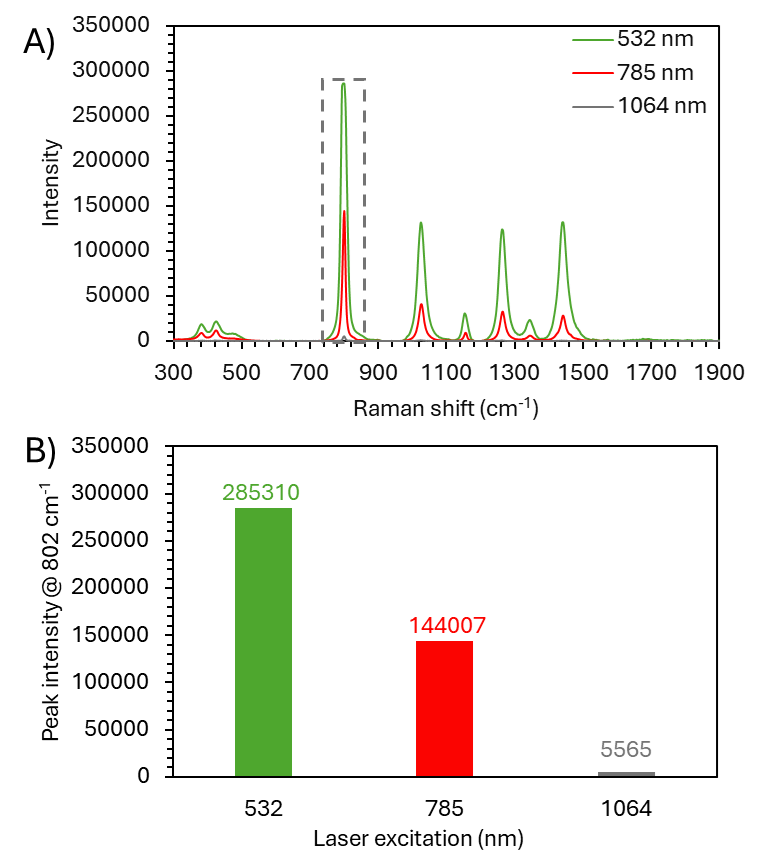
Figure 5. A) Raman spectra of cyclohexane acquired using 532 nm (green trace), 785 nm (red trace), and 1064 nm (grey trace) laser excitation with a 5-second acquisition time. B) Bar chart showing a comparison of each laser excitation for peak intensity at 802 cm-1.
The use of a 1064 nm laser coupled with an InGaAs detector is beneficial when analysing samples with extreme fluorescence interference in Raman microscopy. However, it is significantly less sensitive than other Raman lasers due to the negative fourth power wavelength dependency on Raman spectra and the use of an InGaAs detector to the InGaAs detector. It is therefore only recommended when 785 nm and 830 nm lasers do not sufficiently suppress sample fluorescence. Table 1 provides a guide for the different laser excitations and their impact on factors that would influence Raman qualities and the recommended sample types.
Table 1. Guide for choosing laser excitation wavelengths for a Raman spectrometer.
| 532 nm | 785/830 nm | 1064 nm | |
|---|---|---|---|
| Detector Type | Silicon CCD | Silcon CCD | InGaAs |
| Fluorescence | High | Medium | Low |
| Raman Sensitivity | High | Medium | Low |
| Burning Risk | Low | Medium | High |
| Typical Mapping Speed | Fast | Normal | Slow |
| Optimum Sample Type | Non-fluorescent organic and inorganic samples (carbon nanomaterials, semi-conductors, etc) | Common wavelength choice for most sample types | Dyes, pigments, coloured plastics and oils |
