Back-illuminated charge coupled devices (CCDs) offer superior sensitivity and faster Raman imaging, making them ideal for most Raman applications. However, for specific experiments involving NIR lasers and low-scattering samples, front-illuminated CCDs may be the better option for avoiding etaloning in your spectra.
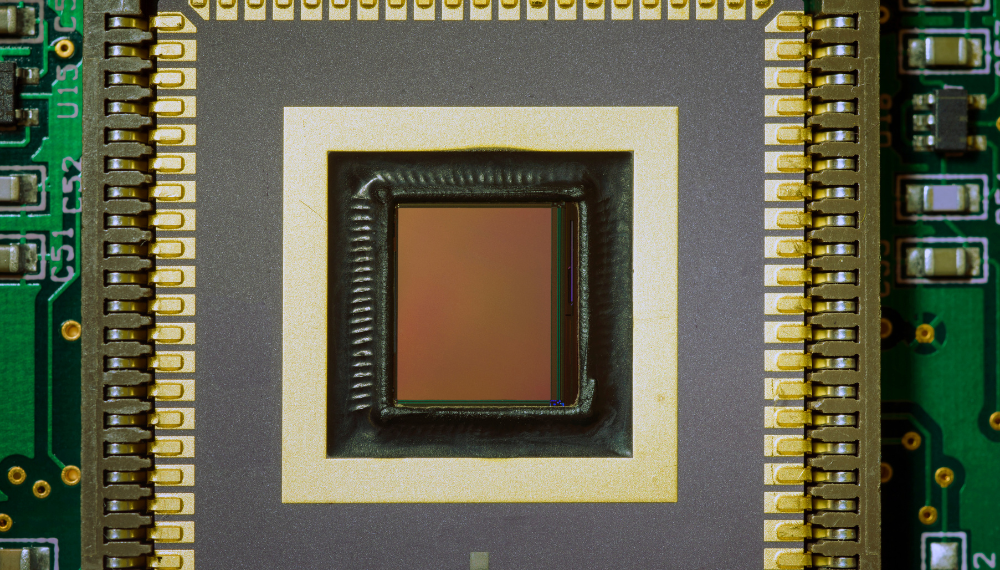
In Raman microscopy, the choice of detector can significantly impact spectral quality. In this Technical Note, we compare the performance of front-illuminated (FI-CCD) and back-illuminated CCDs (BI-CCD) with respect to Raman spectral sensitivity and Raman imaging times. Due to its higher quantum efficiency (QE), the BI-CCD detects a higher Raman signal and has a higher signal-to-noise ratio than a FI-CCD. However, the etaloning effect observed when analysing low Raman scattering samples with 785 nm and 830 nm lasers means the BI-CCD may not always be the best choice.
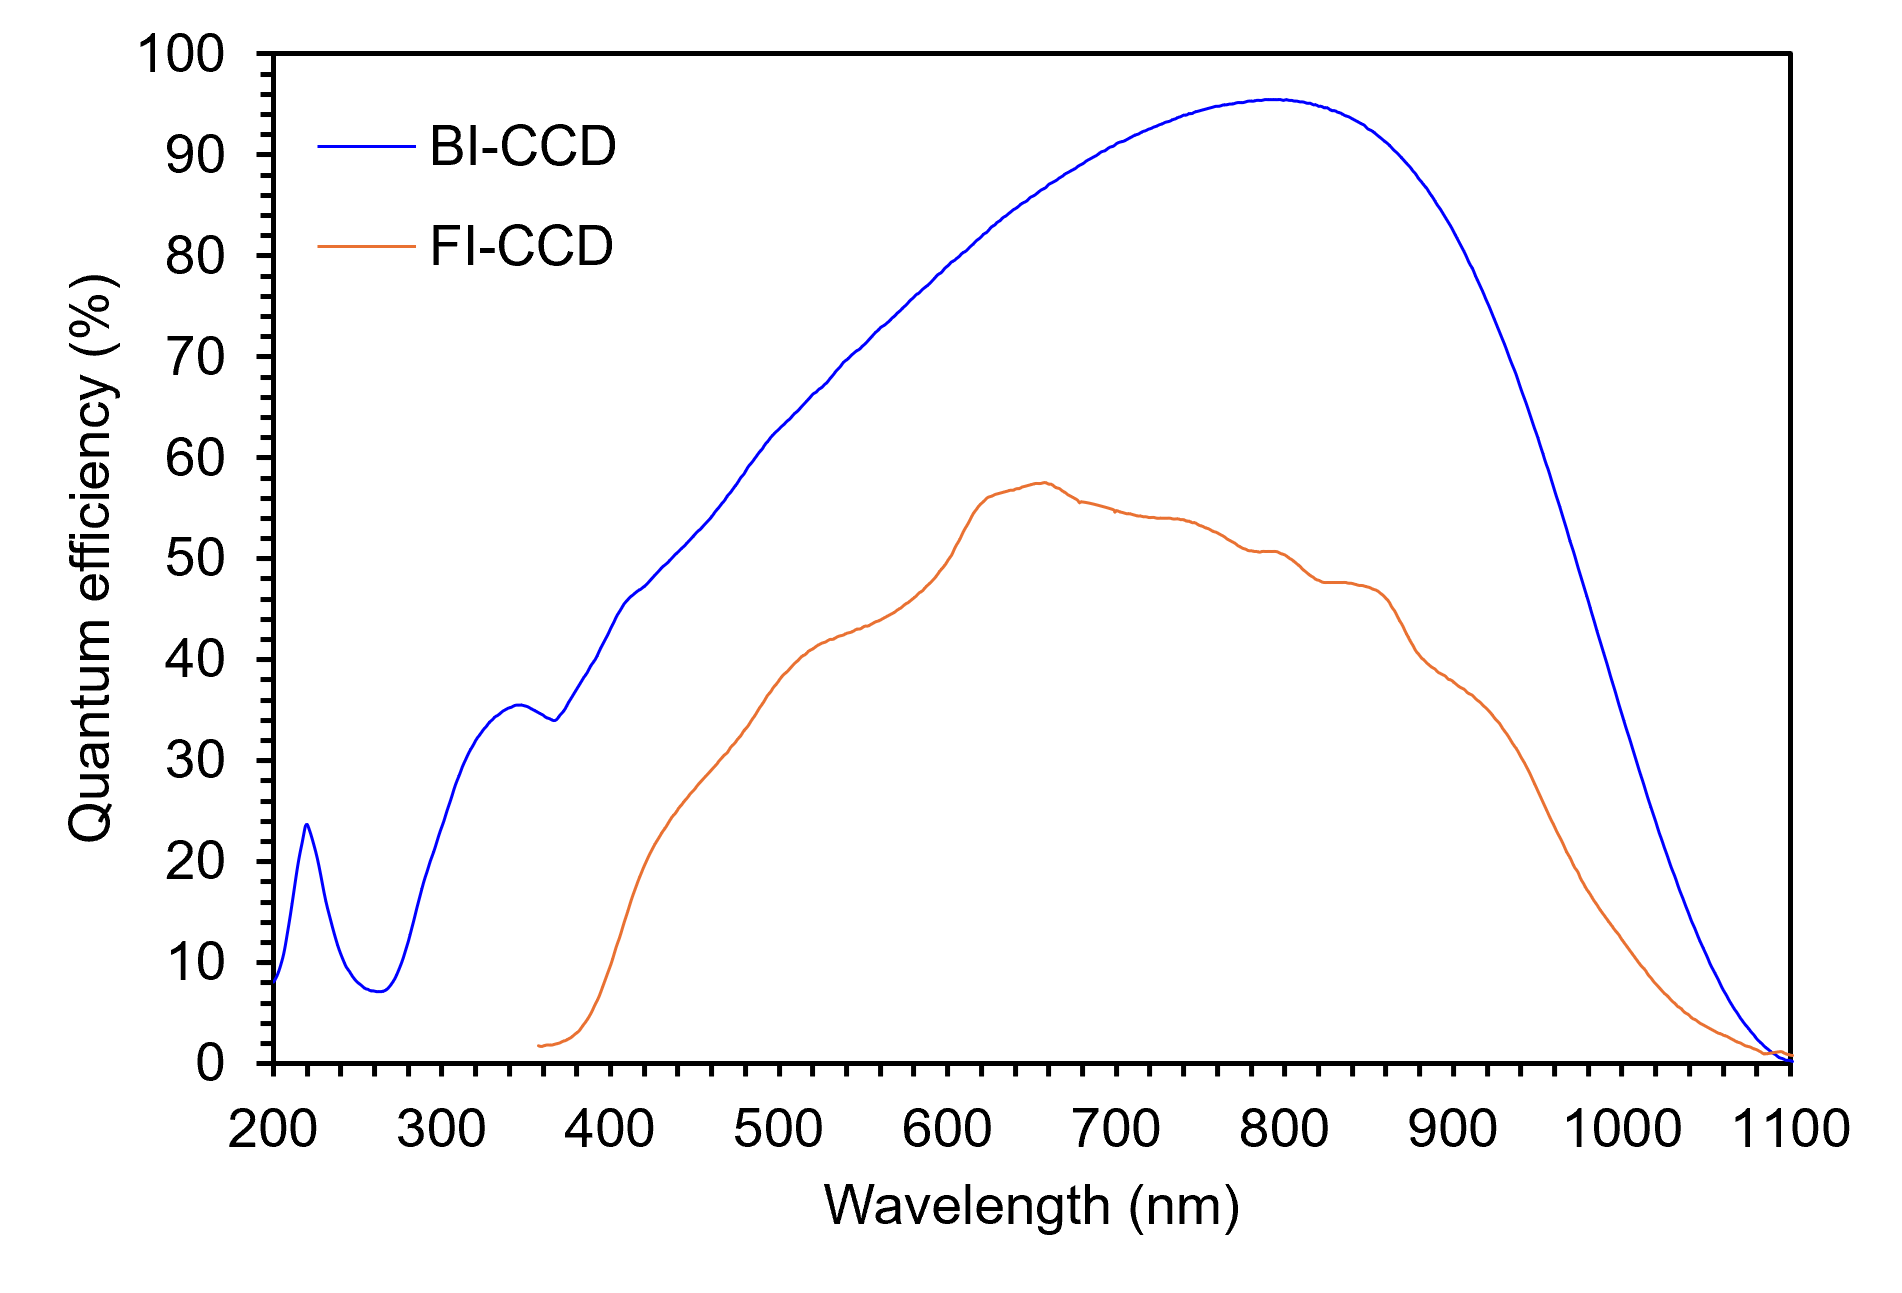 Figure 1. Quantum efficiency curves for the FI-CCD and BI-CCD.
The key metric when choosing a CCD for a Raman microscope is sensitivity. The QE and the noise of the CCD determine sensitivity. High QE and low noise result in high sensitivity. The higher the sensitivity, the shorter the acquisition time required to obtain a Raman spectrum of sufficient quality. To demonstrate the effect of the CCD on spectral sensitivity, Raman spectra were recorded from a silicon chip at excitation wavelengths of 532 nm, 785 nm, and 830 nm. The spectra were detected on an FI-CCD and a BI-CCD sequentially under equivalent conditions and acquisition times.
Figure 2 shows comparisons of the silicon spectrum measured on the two CCDs at three laser wavelengths. The Raman signal magnitude is higher on the BI-CCD at all laser wavelengths. This comparison shows that to achieve an equivalent spectrum quality (signal-to-noise ratio), the FI-CCD would require an acquisition time of approximately 3-5 times longer than the BI-CCD.
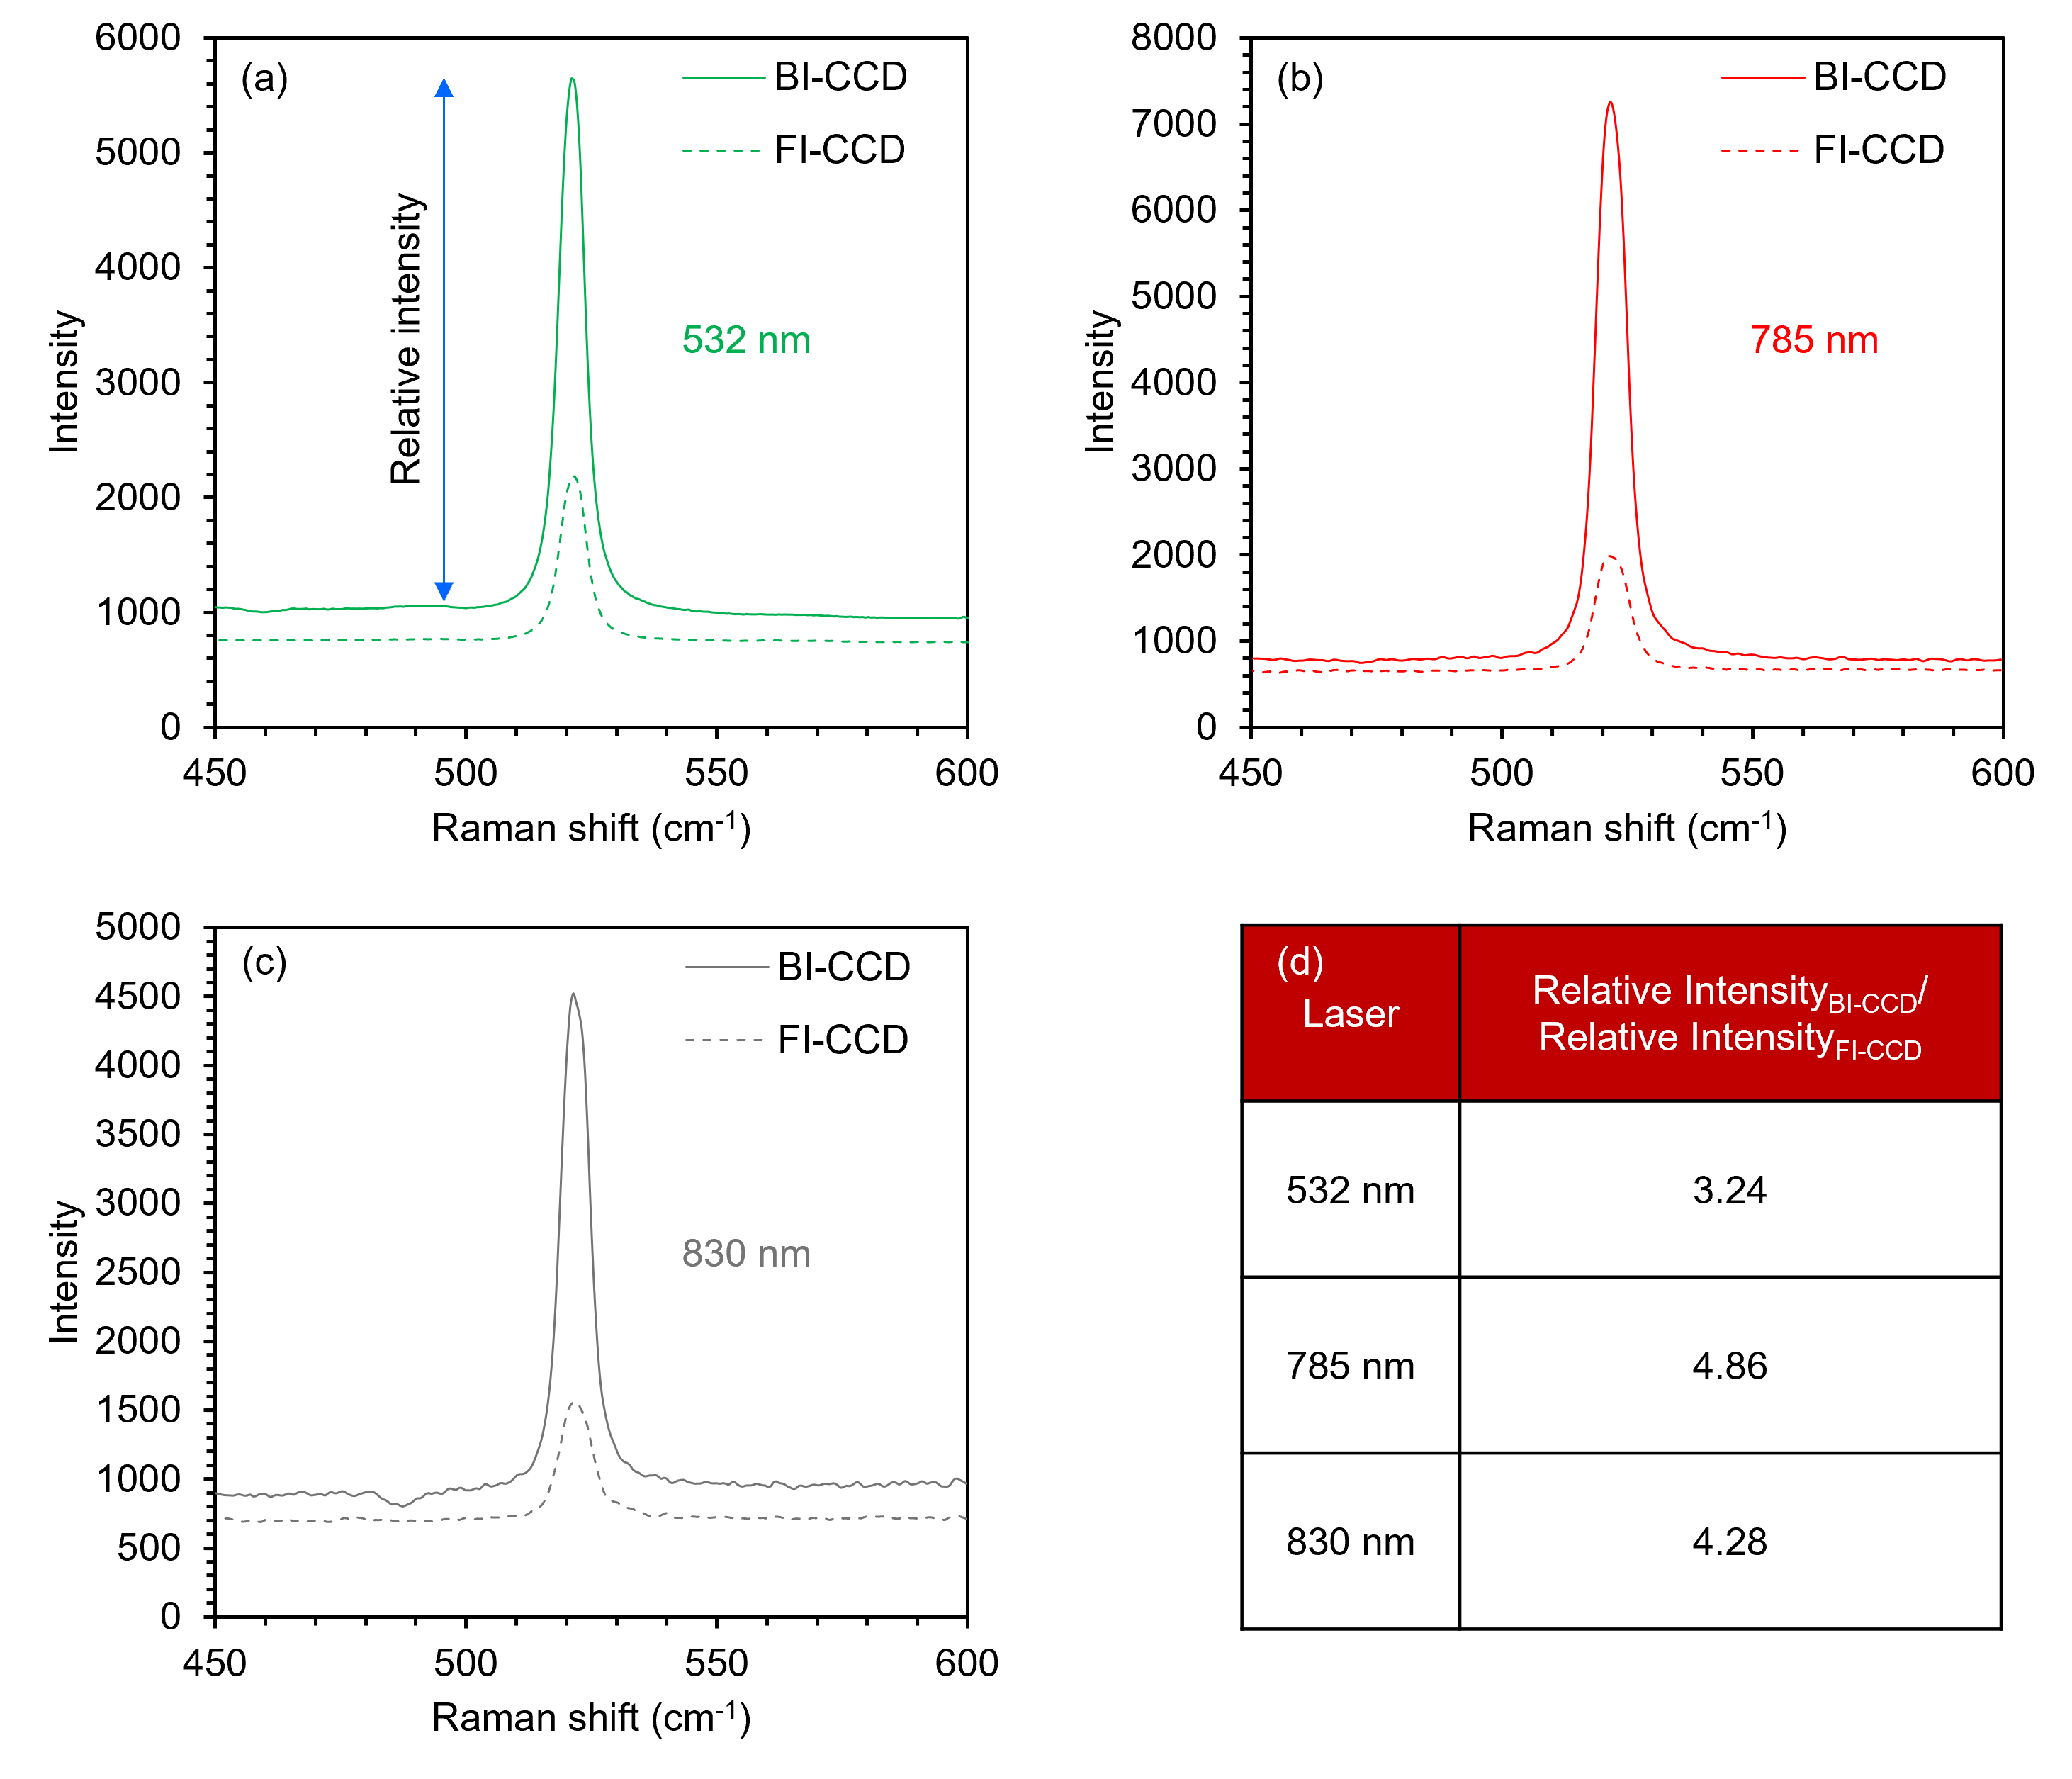 Figure 2. Raman spectral sensitivity measurements for the FI-CCD and BI-CCD recorded with 532 nm, 785 nm, and 830 nm excitation.
The difference in acquisition time to acquire an equivalent quality spectrum is particularly important for Raman imaging. To demonstrate the impact, a Raman image of a carbon nanotube sample was acquired on the BI-CCD and FI-CCD. Achieving a good-quality spectrum of the nanotube G+ band requires an acquisition time of approximately 0.2s per point on the BI-CCD and 0.5s per point on the FI-CCD (Figure 3a). Due to the difference in acquisition per point, the BI-CCD image (Figure 3b) took 50 minutes to acquire compared to 115 minutes for the FI-CCD (Figure 3c). The acquisition time per point on the FI-CCD could, of course, be reduced down to 0.2s to achieve the same total image acquisition time as the BI-CCD but at a loss of spectral quality.
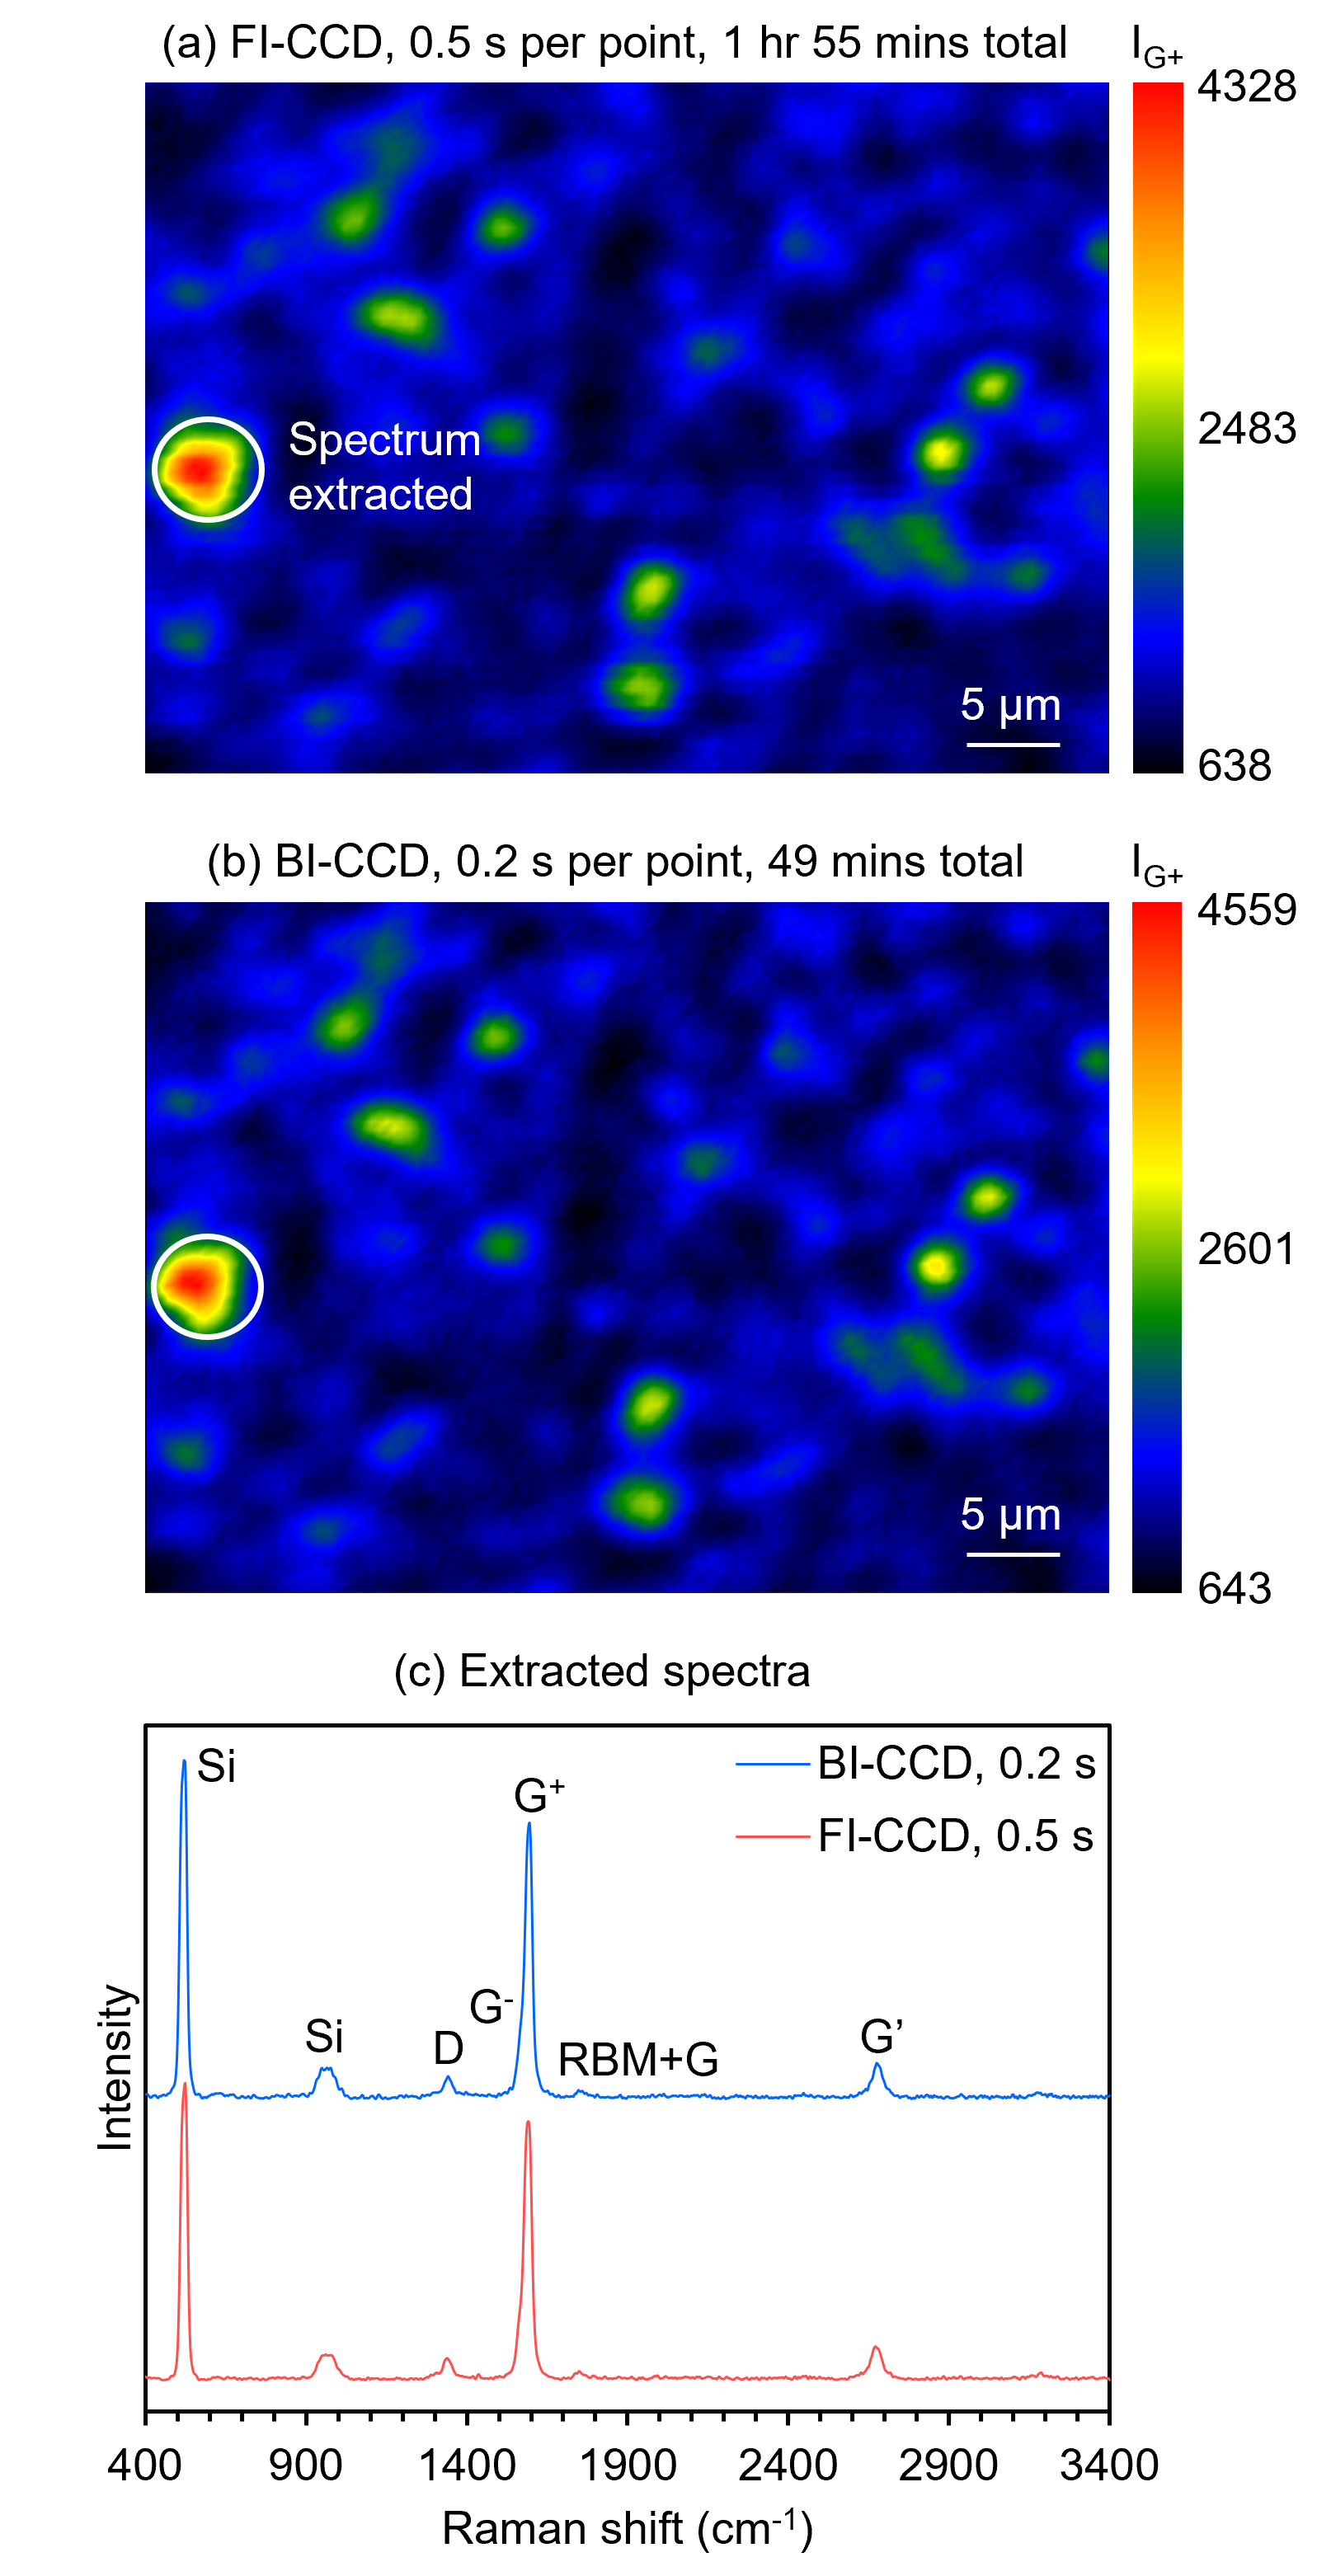 Figure 3. Raman images collected using (a) an FI-CCD and (b) a BI-CCD.
For most Raman applications, the BI-CCD is the superior detector. However, in microscopes only containing 785 nm or 830 nm lasers for analysing low Raman scattering samples, for which long acquisition times are needed, the BI-CCD may not be the optimum choice. This is The FI-CCD may be the better option for systems with only a 785 nm or 830 nm laser for measuring low Raman scattering samples.
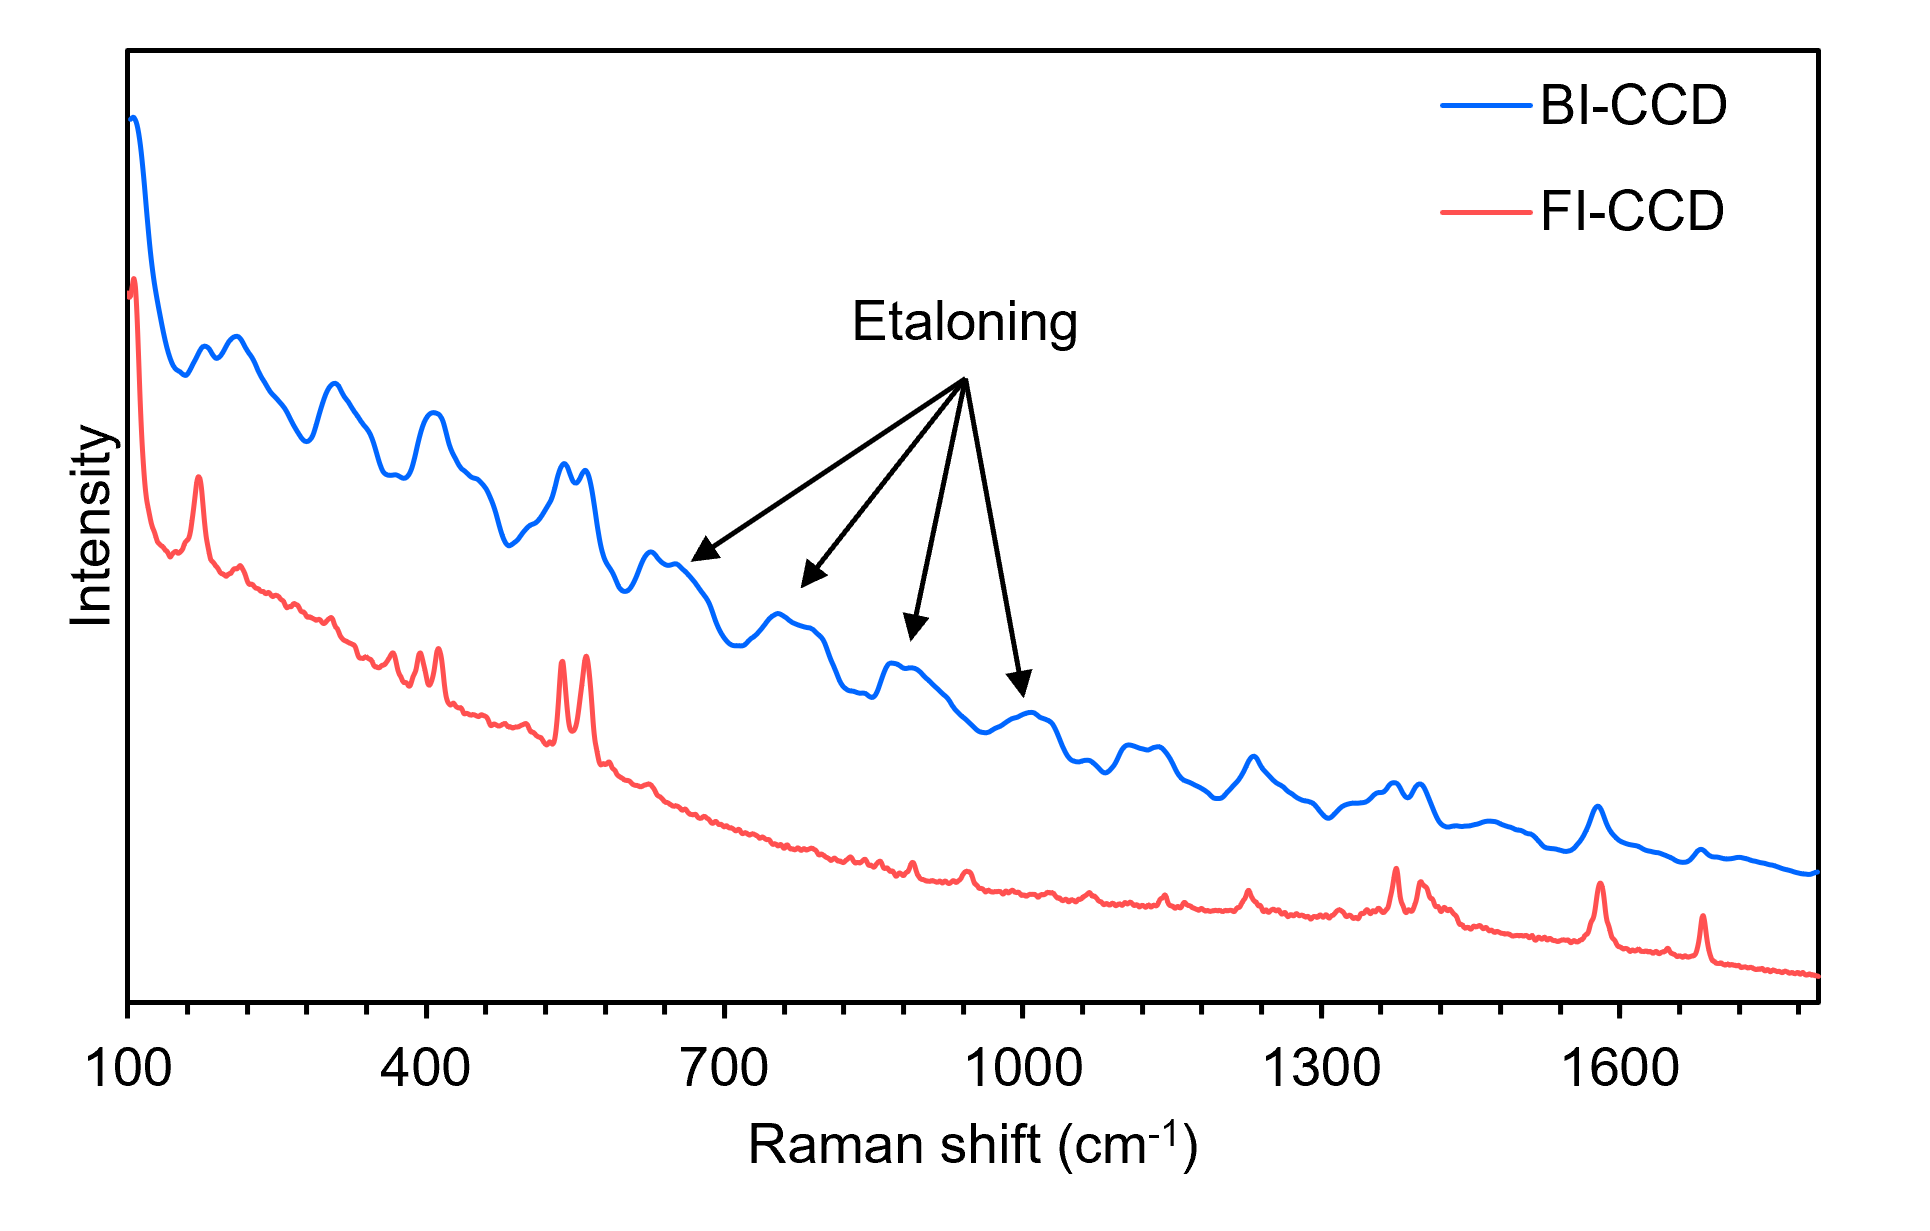 Figure 4. Raman spectra of an organic crystal recorded using a BI-CCD and a FI-CCD.
In this Technical Note, the spectral sensitivity of FI- and BI-CCDs were compared. The BI-CCD provides higher Raman intensities and better spectral sensitivity than the FI-CCD at 532 nm, 785 nm, and 830 nm. Raman images can be acquired twice as quickly on the BI-CCD versus the FI-CCD. Selecting the correct detector for a given application will depend on the excitation wavelength needed, the Raman scattering cross-section of the sample, and the required acquisition speed for spectral analysis or imaging.
No results found.