In flash photolysis, a short pulse of light generates a transient (temporary) species in a sample; e.g. a radical intermediate or a short-lived excited state. As the sample relaxes back to the ground state or the final reaction products, the changes occurring are recorded as a function of time using a spectroscopic technique. A flash photolysis spectrometer typically monitors the change in absorption as a function of time, utilising a second light source (probe) besides the excitation (pump) pulse going through the sample. This technique is also known as transient absorption (TA).
Transient absorption can be performed in a wide range of timescales, from picoseconds to seconds. Experiments in the nanosecond to seconds range have many applications involving detection of free radicals, excited states, and charge transfer reaction intermediates. It is the technique of choice to study reaction kinetics1,the lifetimes of non-emissive triplet states2, and to detect elusive intermediates in light-triggered processes.3 Therefore it is very useful in fundamental photochemistry, materials science, and photobiology.
For these type of studies Edinburgh Instruments offers a turn-key laser flash photolysis instrument, the LP980. This technical note is aimed as an introduction to nanosecond flash photolysis for newcomers to the technique. We describe the operation of the LP980 spectrometer and show examples of measurements, with references to real-life applications.
The basic components of a flash photolysis system are light sources that act as an optical pump and probe, a monochromator and a detector. The LP980 integrates all of these components into one instrument, shown in Figure 1.
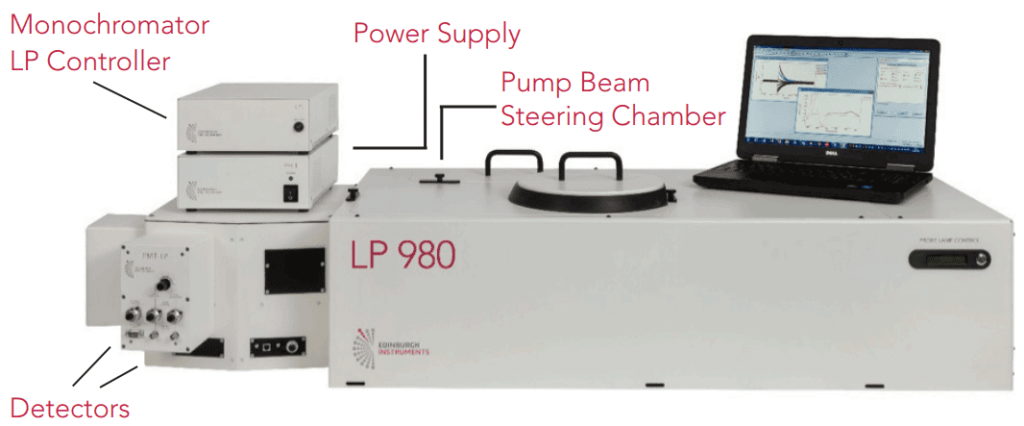
The pump pulse creates the transient excited species and acts as time zero for the experiment. Typically a laser of high energy and nanosecond pulses is used such as Nd:YAG. The LP980 offers flexibility to couple to different lasers and OPOs. The steering chamber enables aligning the pump laser into the sample chamber and changing between the different optical configurations easily.
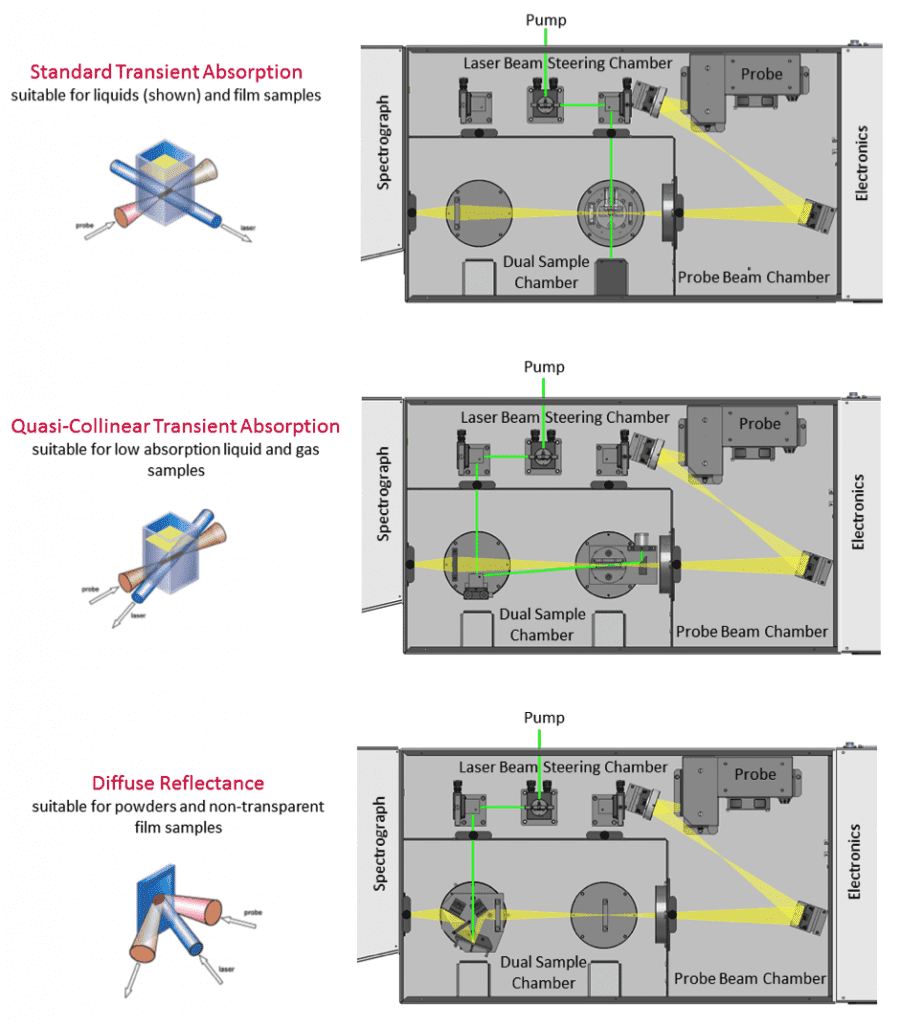
The probe beam is produced by a white-light source to study absorption at different wavelengths. The LP980 features a xenon lamp that can be used in continuous or pulsed mode for higher energy. With regards to the sample, TA can be studied in liquids, solids or gas cells by changing the sample holder and optical configuration. Different sample configuration options for the LP980 are shown in Figure 2.
The detection arm features a monochromator to select the probe wavelength range of interest. The LP980 offers the unique option of a photomultiplier tube (PMT) and intensified CCD camera (ICCD) simultaneously mounted on the same monochromator, so that the user can easily alternate between spectral (ICCD) and time-resolved (PMT) acquisition.
The PMT detector, camera and oscilloscope models can be chosen to provide the spectral range and time resolution of interest for the application. Data averaging, which is essential in TA, can be carried out either by the oscilloscope or the computer
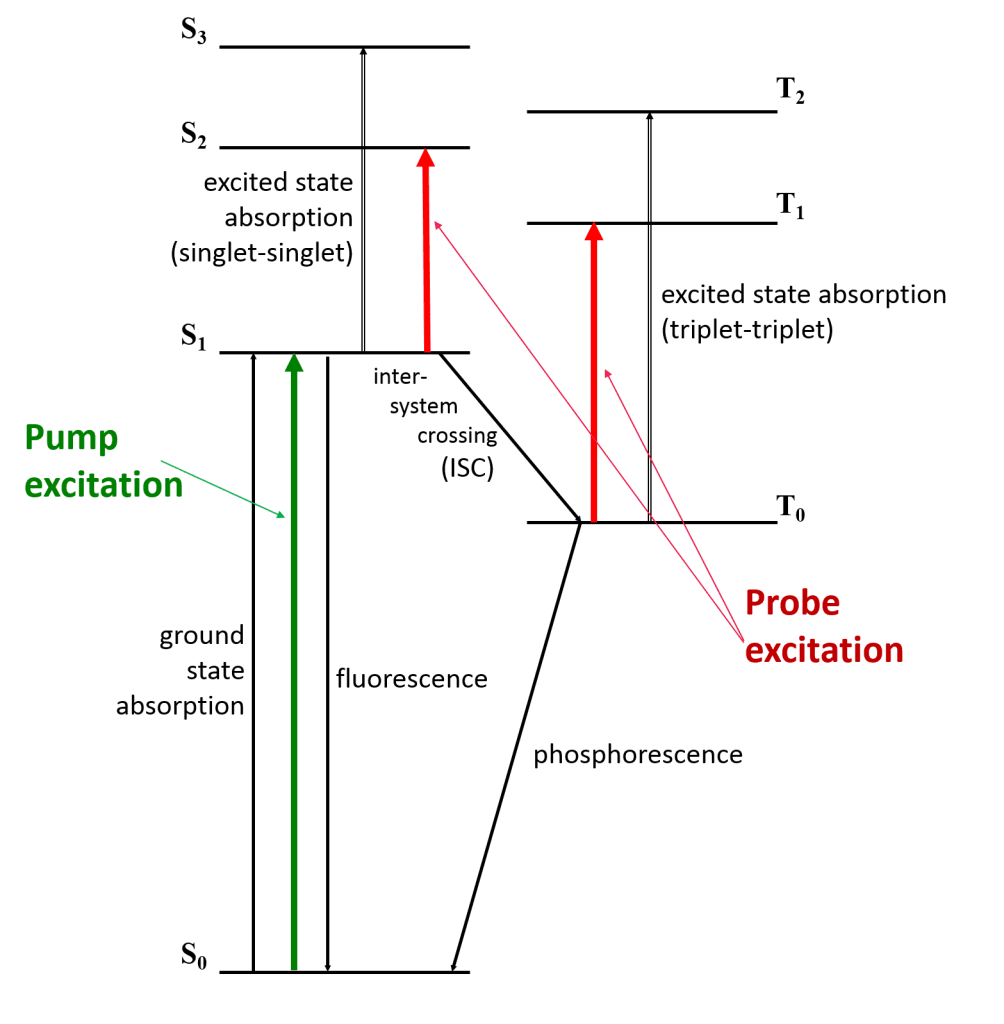
To understand what happens in a TA experiment, we will look at the example of an excited triple state. Figure 3 shows an energy diagram of a species that is excited with the pump beam to the state S1, which then populates the triplet T1 by intersystem crossing.
The lifetime of the triplet state may be determined from its phosphorescence lifetime; however, if luminescence cannot be detected the TA of the triplet state may be used instead. The change in T1 absorbance as a function of time is recorded by monitoring the probe beam at the T1–Tn transition wavelength. As the excited state population decays from T1 to the ground state S0, this absorbance will decrease.
The PMT detector, camera and oscilloscope models can be chosen to provide the spectral range and time resolution of interest for the application. Data averaging, which is essential in TA, can be carried out either by the oscilloscope or the computer.
Typically the probe beam is on before the pump pulse reaches the sample and this allows to characterise the background of the experiment. The “probe-only” spectrum corresponds to the ground state absorption, whereas the “pump + probe” spectrum contains contributions from both the ground and excited states. TA data are usually presented as the change in absorption ΔOD, which is effectively the difference between the “pump + probe” and the “probe-only” spectra: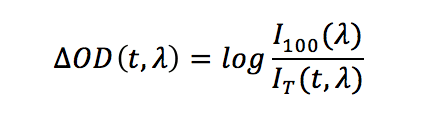
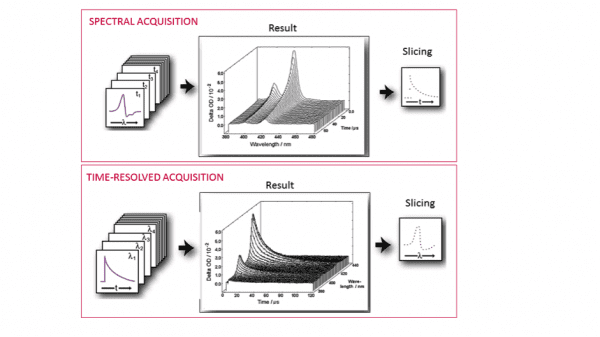
In the above equation, I100 is the “probe-only” intensity (measured before the pump pulse) and IT is the time dependent “pump + probe” intensity at a given wavelength λ. The ΔOD data can be acquired and visualised in two ways: a series of spectra as a function of time (spectral mode), or a series of decays as a function of wavelength (time-resolved mode).
The PMT and monochromator configuration is the choice for time-resolved data acquisition, whereas an ICCD camera on a spectrograph enables acquisition in spectral mode. However, the information acquired is essentially the same (Figure 4). The LP980 data acquisition software, L900, allows converting between spectral and temporal traces by slicing the data.
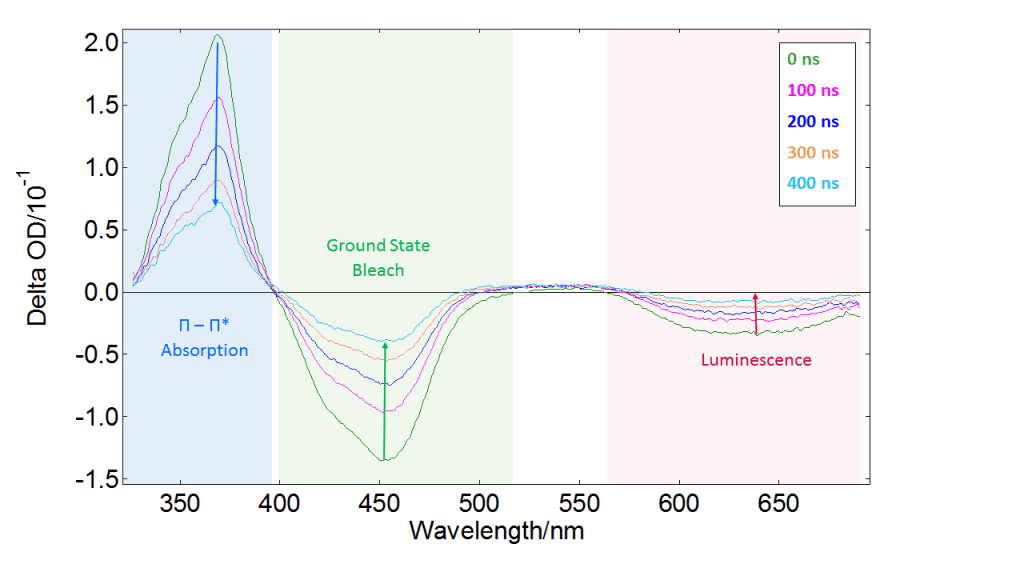
If the sample is not well studied, it is advisable to start with spectral measurements. The ICCD detector allows to capture the full absorption spectrum in one shot, taking a “picture” of the sample which contains contributions from all absorbing transient species. Varying the delay of the ICCD trigger provides the behaviour of these transient species as a function of time. Therefore we can quickly obtain a general idea of what is happening in the experiment. An example of spectral triplet-state detection is presented in Figure 5. The data correspond to a tris(bipyridine)ruthenium(II) chloride complex, [Ru(bpy)3]Cl2, which has a long-lived triplet state with interesting redox properties and many applications in sensors and photovoltaic devices.4
Figure 5 shows spectral data acquired by triggering the ICCD at different delays after the pump pulse. There is a positive ΔOD component at 370 nm that decreases with time and corresponds to the a π-π* transition which has the same lifetime as the T1 state. The negative component at 450 nm, also approaching the baseline at longer times, is the absorption of the ground state S0 (ground state “bleach”).
This behaviour arises because S0 is depleted by the pump pulse at time zero, and gradually repopulated as the system relaxes back to the ground state. Finally, the large negative component at long wavelengths corresponds to luminescence excited by the pump pulse. This can obscure other features of the spectrum, but is easily removed by acquiring pump-only data. The L900 software offers automatic correction for this background as an option.
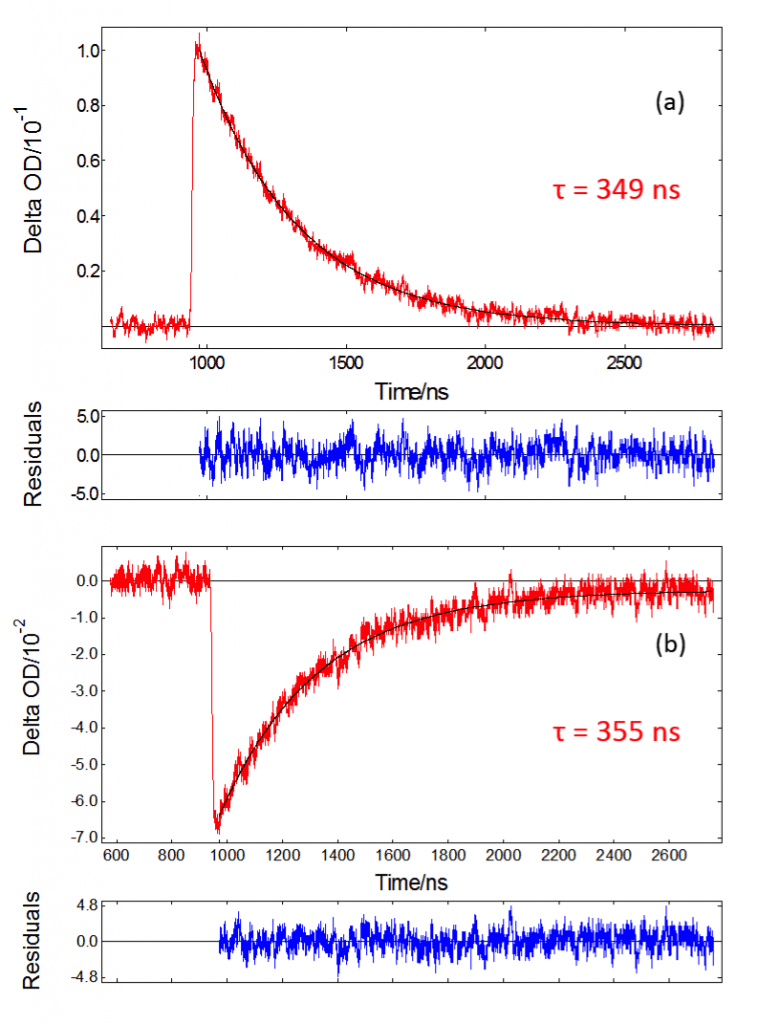
After acquiring spectral data, it may be interesting to focus on particular wavelengths to study the kinetics of certain processes. Figure 6 shows kinetic data for [Ru(bpy)3]Cl2 acquired with the PMT detector in the LP980. The monochromator allows detection of a single wavelength, isolating the process of interest with good time resolution. The π-π* absorption decay is shown in Figure 6a, whereas Figure 6b shows the ground state bleach. Both traces have been fitted to a first-order exponential decay in L900,
Where ΔOD0 is the initial ΔOD and k1 is the first-order rate constant. Other orders of decay can be fitted in L900 to study more complex processes such as triplet-triplet annihilation. In this case a first-order decay with a single exponential component is suitable. The Marquart-Levenberg tail fitting algorithm built into L900 was used to find triplet lifetime values τ1 = 1/k1 .370 nm TA and ground state bleach lifetimes are in agreement with each other.
Laser flash photolysis is a versatile technique for the study of time-resolved processes in the range of nanoseconds to seconds. It complements time-resolved luminescence as in some cases absorption is a better choice of detection method. The large time range covered by a flash photolysis spectrometer results in a huge variety of potential applications, from reaction kinetics to photophysics studies. A highly configurable turn-key commercial instrument such as the LP980 can be adapted to suit each particular application, and offers single-shot spectral acquisition with the ICCD detector.